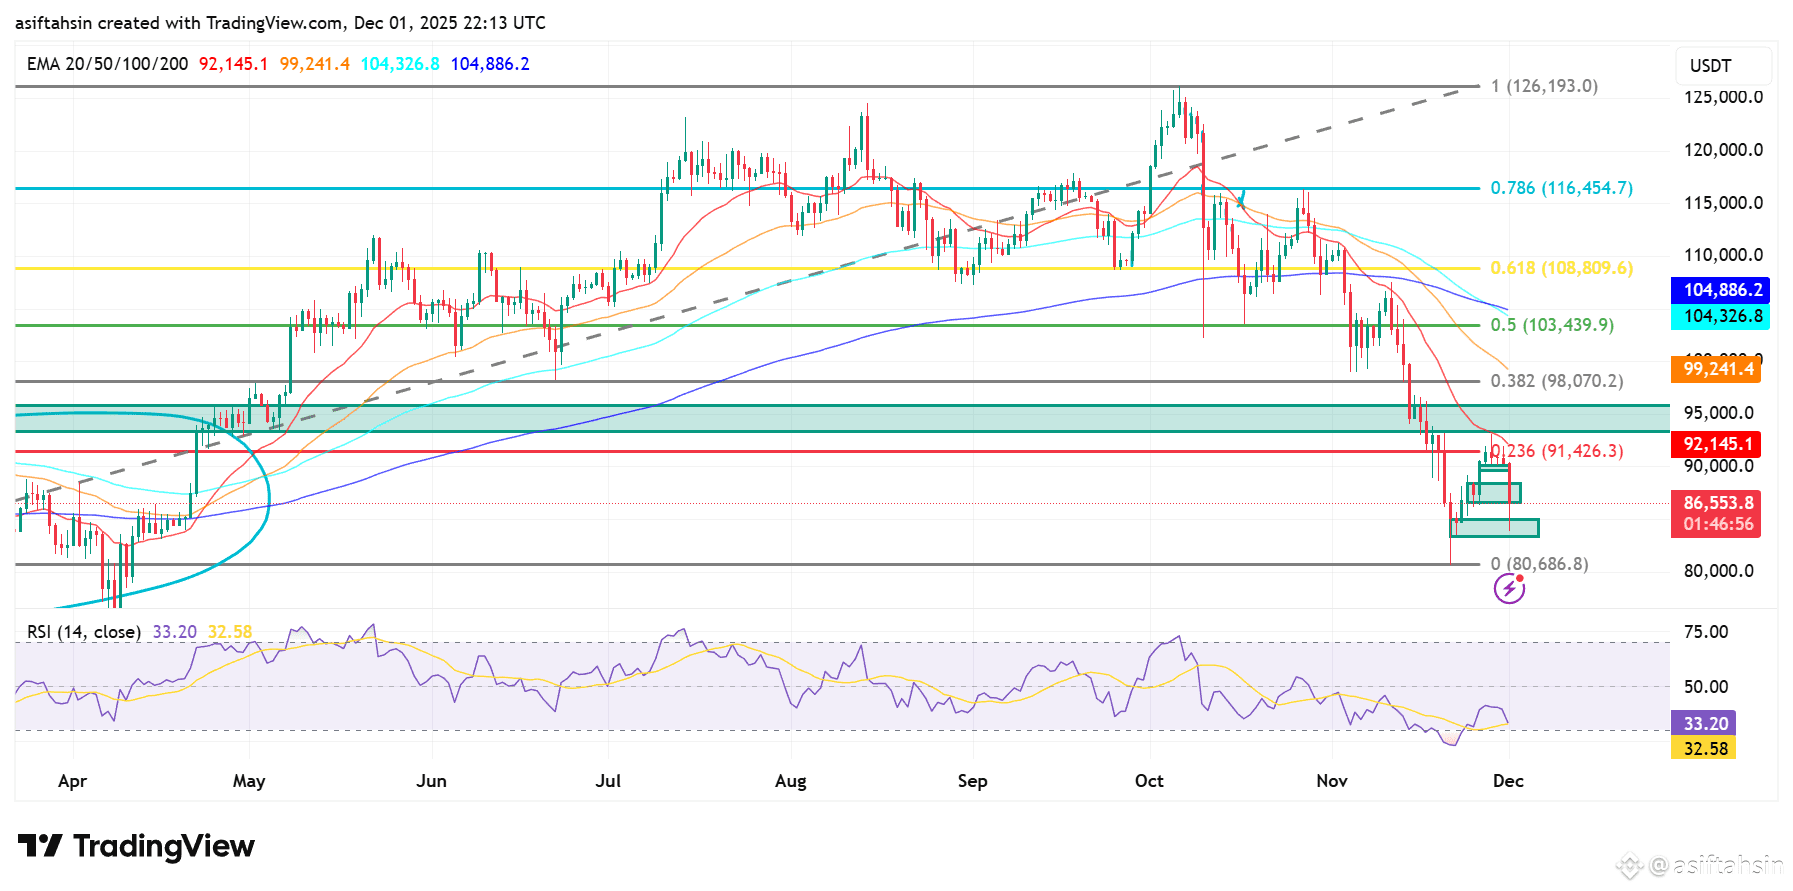
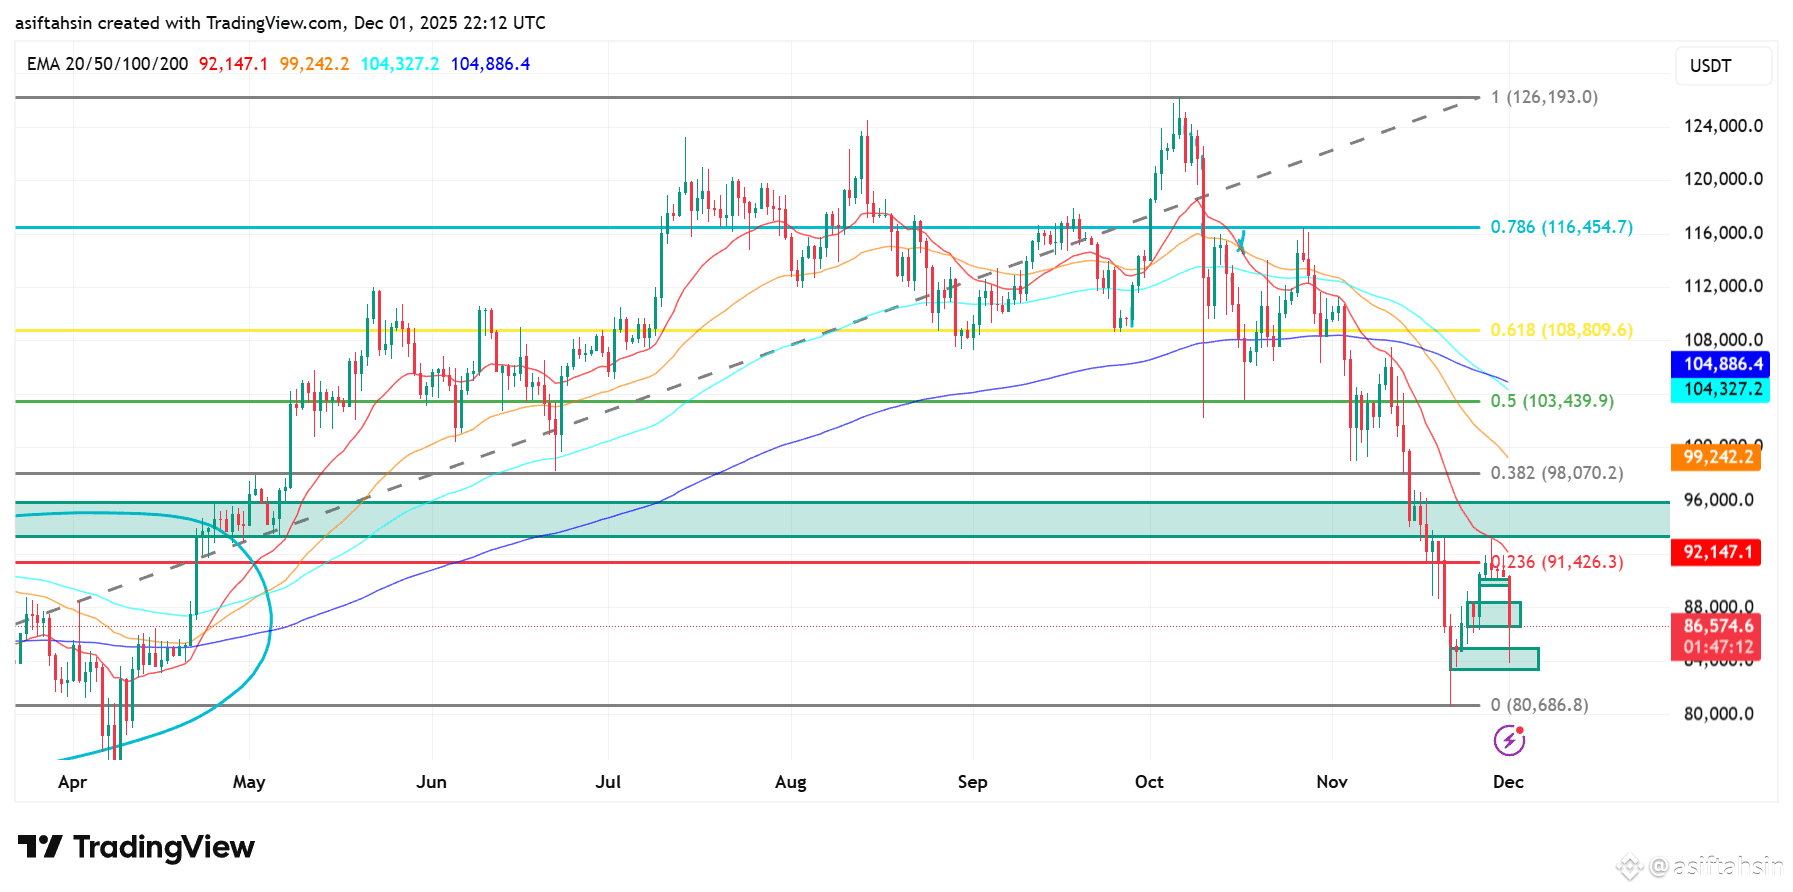
BTC is trying to hold above the $84,000–$86,500 demand zone after a heavy sell-off from the $117,000–$120,000 region, where a clear distribution pattern formed. The breakdown accelerated once BTC lost the 20 EMA ($92,145), 50 EMA ($99,241), 100 EMA ($104,326), and 200 EMA ($104,886) — all now acting as strong resistance layers.
Yesterday’s bounce from $86,000 showed some short-term defense, but price failed to sustain momentum above the 0.236 Fib level at $91,426, confirming that sellers still control the market. As long as BTC trades below this threshold, upside moves remain corrective rather than trend-changing.
A daily close above $91,400 would be the first sign of recovery. Stronger confirmation comes only if BTC can reclaim $98,070 (0.382 Fib) and then push toward $103,439 (0.5 Fib) — a major resistance cluster aligned with the EMAs. A breakout above $108,809 (0.618 Fib) would shift the broader structure back toward bullish continuation.
On the downside, losing the current support zone could expose BTC to $80,686 (Fib 0), which remains the next major target if sellers regain momentum.
RSI at 33.20 indicates weak momentum but shows early signs of stabilization, suggesting a possible relief bounce — though not enough yet to flip trend direction.
📊 Key Levels
Resistance
$91,426 (0.236 Fib)
$98,070 (0.382 Fib)
$103,439 (0.5 Fib)
$108,809 (0.618 Fib)
$116,454 (0.786 Fib)
Support
$86,500 → $84,000 (strong demand zone)
$80,686 (major support, Fib 0)
RSI
33.20 — weak but attempting to recover
📌 Summary
BTC is holding inside a key support region after a deep correction, but the broader trend stays bearish below $91K–$98K. A break above $103K would be the first strong bullish signal, while losing $84K risks a drop toward $80K.
