Once upon a time, not too long ago, Bitcoin soared 🚀 to a dazzling peak of $126,199.63. Traders celebrated 🎉. Screenshots flooded every timeline 📱. Predictions of "$200K by year-end" echoed across crypto Twitter 🐦. Everyone believed the sky ☁️ was the limit.
But markets have a way of humbling even the boldest dreamers 😅. What followed was a brutal, relentless slide 🔻 — carving through support after support, shaking out weak hands 🙌 at every level — until BTC finally found itself bruised and battered 🩹 at $59,130.91. Fortunes flipped overnight 🌙. Some wept 😢. Others, the patient ones, quietly accumulated 🐢💰.
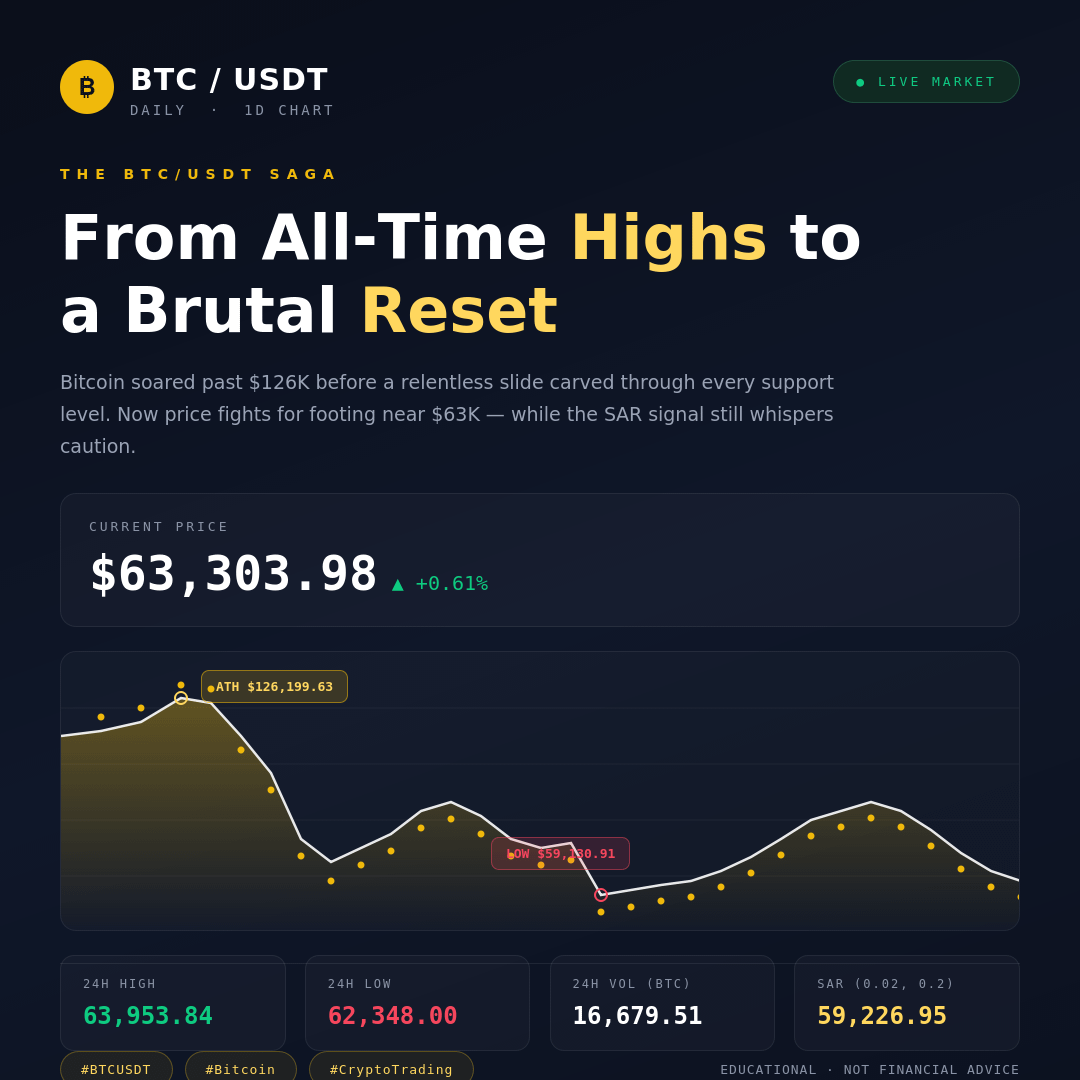
Now, BTC/USDT trades at $63,303.98, up +0.61% 🟢 on the day. A small flicker of green ✨ in what's been a sea of red 🔴. The 24h range tells its own story: a high of $63,953.84, a low of $62,348.00 — tight, but tense 😬.
The Parabolic SAR (59,226.95) 🟠 still hovers above price, whispering caution ⚠️. The bears 🐻 haven't fully left the room.
Yet volume doesn't lie 📊: 16,679.51 $BTC changed hands — a staggering $1.06B 💵 in USDT. That's not silence. That's conviction, fear, and greed colliding in real time 🔥.
So here's the real question: while everyone debates "top or bottom" 🤔, are you watching from the sidelines... or writing your own chapter in this story? ✍️
🔍 Technical Read
For those following the chart closely: a flip of the Parabolic SAR 🟠 from above price to below it is typically read by technical traders as an early signal 🟢 of a potential trend shift toward the upside — while SAR remaining above price, as it currently is, is generally interpreted as confirmation of an ongoing downtrend 🔴. The $59,130 zone 🎯 has acted as a key reaction point, and how price behaves around similar levels going forward often shapes trader sentiment ⏳ in the short term.
⚠️ This is for educational purposes only — not financial advice 🚫💰. Always do your own research (DYOR) 🧐 and manage risk according to your own strategy. 🧠
#BTCUSDT #Bitcoin #CryptoTrading #BTC #CryptoNews 🪙