In Part 1, we established that smart money follows a playbook.
Now it's time to read that playbook.
You've seen it before. A coin pumps 300%. You buy. It dumps. You panic sell. Then it pumps again without you.
That wasn't bad luck. That was a cycle, and you were on the wrong side of it.
Wyckoff didn't just identify the laws that drive price. He mapped out the 4-phase cycle smart money uses to execute them. And once you see it, you can never unsee it.
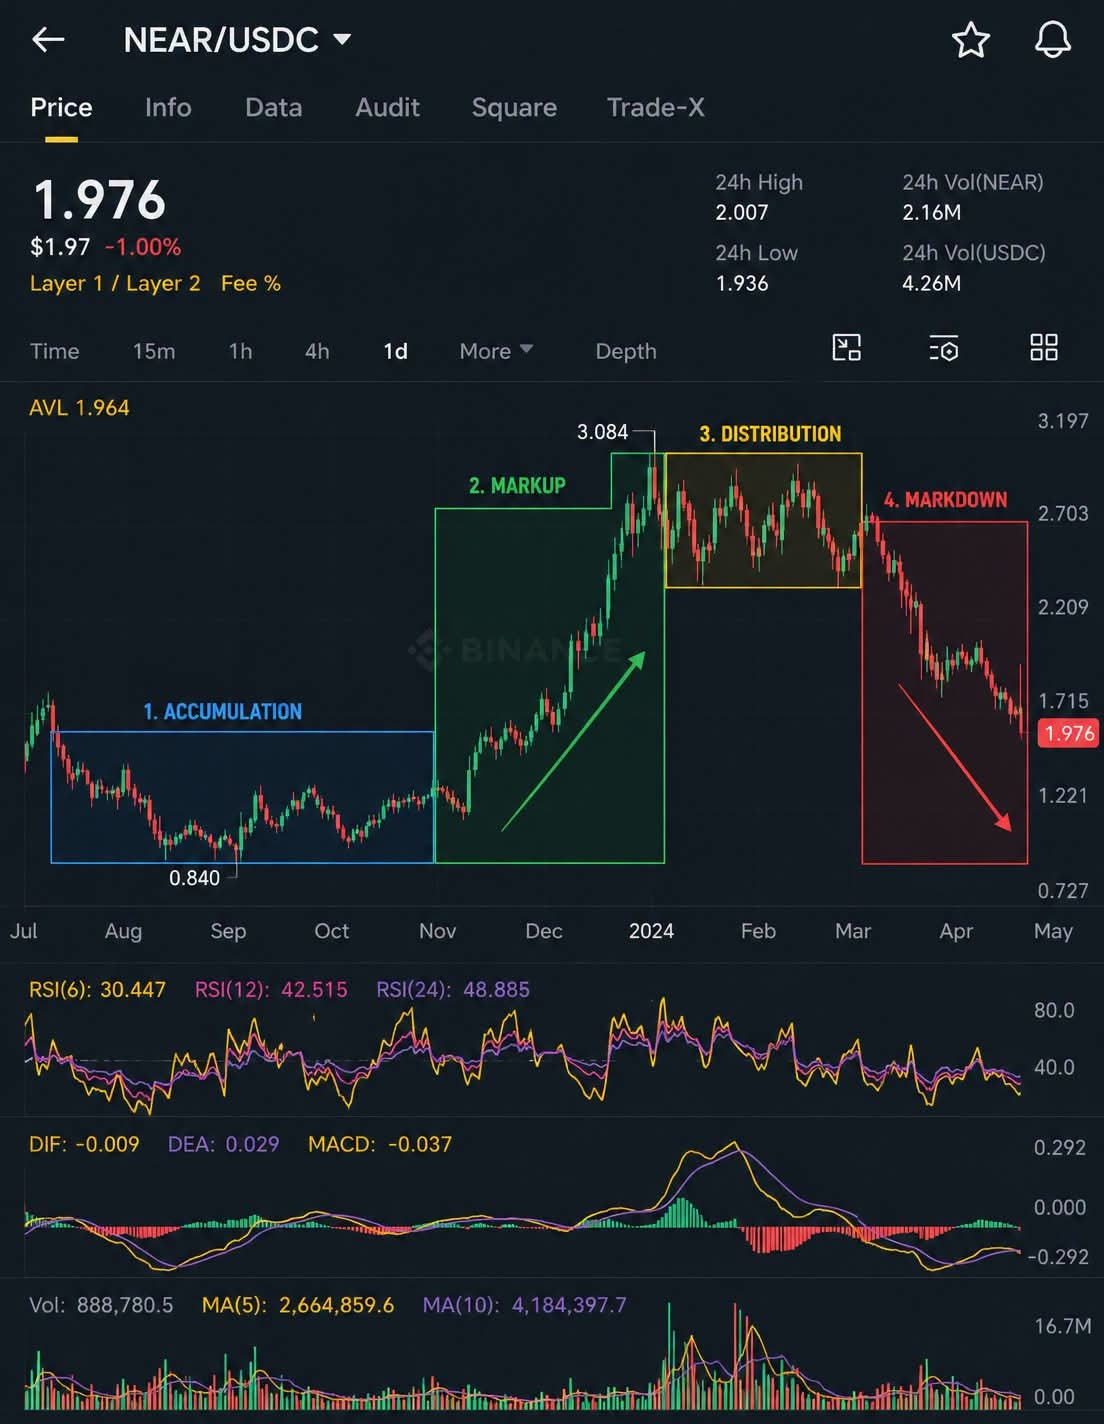
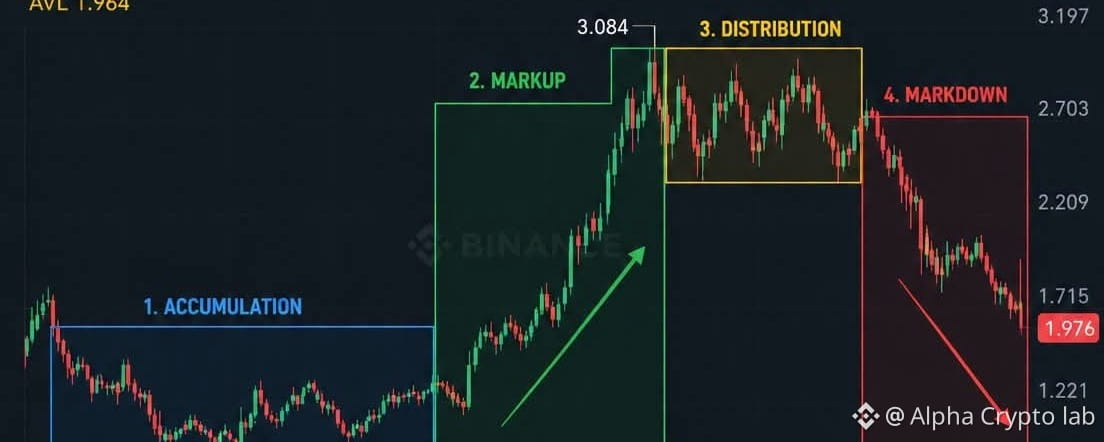
The 4 phases are: Accumulation, Markup, Distribution, and Markdown. Let's break each one down
Phase.1 Accomutation
This is where smart money goes shopping.
After a prolonged downtrend, price stops falling and enters a long sideways range. Nothing exciting is happening. Volume is low. And that's exactly how smart money wants it.
While everyone looks away, institutions are quietly buying, not all at once, but slowly and deliberately. They can't buy everything at once because a sudden surge in buying would spike the price before they've built their full position.
So they take their time. Weeks. Sometimes months.
Think about $BTC before its historic 2020 rally. While most traders were bored by months of sideways price action, institutions were quietly accumulating.
The accumulation phase always looks boring from the outside. That's the point.
Key sign to watch: A long sideways range after a downtrend, on decreasing volume, while sentiment remains negative.
Phase 2: Markup
This is the strong uptrend everyone loves.
After accumulating enough, smart money starts pushing price higher. As price rises, more regular traders jump in, creating even more demand. Higher highs and higher lows form. This is where the big profits are made for those who bought in the accumulation phase.
This creates what Wyckoff called a virtuous cycle: rising prices attract more buyers, which drives prices even higher.
But here's what most people miss: by the time retail is fully excited and buying aggressively, smart money has already been in the trade for months.
You're not early. You're the fuel.
Phase 3: Distribution
This is where smart money goes to the exit quietly.
After a strong markup, price enters another sideways range near the top. It looks similar to accumulation, but the context is completely different. This time, institutions are not buying. They are selling. Offloading their positions into the demand created by late retail buyers who just discovered the trade.
The challenge? It doesn't look like selling.
Price is still near the highs. Sentiment is euphoric. Everyone is calling for new all-time highs. And smart money is handing their bags to whoever is willing to buy them.
This is where most retail traders get trapped, not because they're stupid, but because the market looks the most bullish right before it turns.
One key pattern to watch here is what Wyckoff called the upthrust: a false breakout above the range that traps late buyers before price reverses sharply to the downside.
Key sign to watch: A sideways range after a strong uptrend, with price struggling to make new highs and volume spiking on down moves.
Phase 4: Markdown
This is the phase no one wants to be caught in.
Once distribution is complete and smart money has fully exited, there are no more large buyers left to support the price. It breaks down, and it breaks down fast.
Falling prices trigger fear. Fear triggers more selling. More selling triggers even more fear.
Wyckoff noted that markdown phases are almost always faster and more violent than markup phases, because fear is a stronger emotion than greed.
Think about some of crypto's biggest crashes. Moves that took months to build were wiped out in days. Retail traders who bought near the top held on, hoping for a recovery, while smart money had long since exited during distribution.
The markdown continues until selling exhausts itself completely, and a new accumulation phase begins.
The cycle resets.
Four phases. One complete cycle. Smart money operates deliberately at every stage. Your job as a trader is simple: identify which phase you're in before you place a trade.
If you've ever wondered what the Wyckoff cycle looks like on a real chart, $NEAR provides a fairly clean example of Accumulation → Markup → Distribution → Markdown.
Which phase do you think the market is currently in? Drop your answer in the comments 👇
In Part 3, we go even deeper, we break down the exact price patterns inside accumulation and distribution that signal when smart money is entering and exiting, so you can follow their footprints on any chart.
Follow so you don't miss it. 🔔