$XRP Here’s the latest XRP (Ripple) market analysis — combining price action, technicals, sentiment, and catalysts (as of Jan 17, 2026):

XRP (XRP)
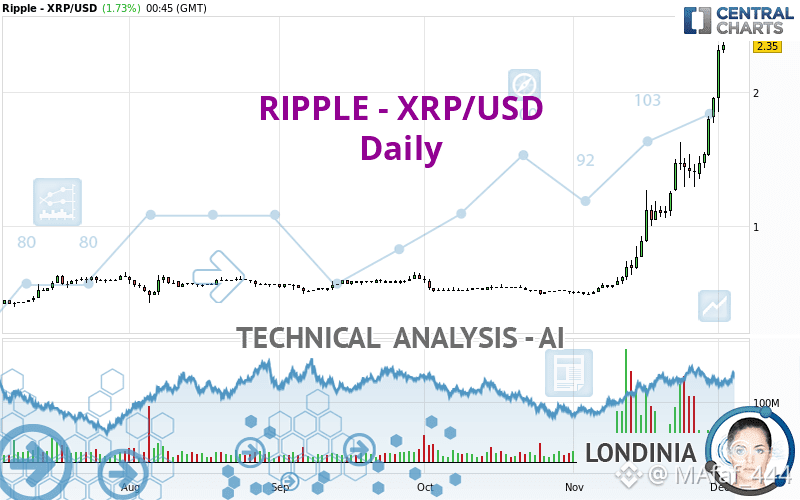
$2.06
-$0.01(-0.48%)Today
1D5D1M6MYTD1Y5Ymax
📉 Current Price Action
XRP is around $2.06–$2.10, drifting lower amid broader crypto weakness. Recent sessions show three days of declines toward key support near $2.00.
The token has slipped below short-term moving averages (e.g., 50-day EMA), signaling bearish momentum in the very short term.
📊 Short-Term Technical Outlook
Bearish Signals
Pullbacks and Sell Pressure: Recent price action shows heavier selling, making deeper corrections possible if $2.00 breaks.
Oversold Conditions: Indicators like RSI have pushed XRP into oversold territory, which often attracts buyers but can also indicate weak momentum.
Bullish Reversal Potential
Market structure still holds some key support zones near current levels, and oversold conditions can lead to short-term bounces.
Broader crypto strength (e.g., Bitcoin rallies) can improve appetite for XRP.
👉 Key levels to monitor
Support: $2.00 — a critical psychological floor.
Resistance: Near $2.13–$2.20 in the very short term.
📈 Medium to Long-Term Outlook
Bullish Factors
Regulatory progress & institutional flows: Expansion of XRP spot ETFs and regulatory clarity have improved confidence and institutional participation.
ETF Inflows: ETF funds tied to XRP have shown significant asset accumulation, which could sustain medium-term price support.
Technical Patterns: Some analysts point to bullish formations and oversold rebounds that could set up a momentum shift higher.
Bearish Risks
Some weekly technicals still show sellers dominating, with bearish momentum in broader market indicators.
Failure to reclaim resistance levels (e.g., $2.20–$2.30) may cap upside.
📌 Price Predictions & Forecasts (From Analysts & Models)
Note: These are speculative forecasts — real price outcomes can vary widely.
Bullish Scenarios
$3.60–$5.00 range: Analysts see potential if ETF flows persist and resistance breaks.
Aggressive targets ($6–$18+): Some analysts with aggressive assumptions (trend continuations) project higher, though these are highly speculative.
Conservative/Mixed View
Moderate recovery: Many models suggest $3–$5 targets if macro conditions turn supportive.
Bearish risk: A failure of key supports could lead to deeper corrections before any recovery.
🧠 Market Sentiment
Bearish near-term as sellers dominate price action.
Neutral to cautiously bullish mid/long term driven by ETFs, regulatory clarity, and potential institutional interest.
TimeframeBiasKey LevelsShort-Term (days)Bearish to neutralSupport $2.00 / Resistance ~$2.20Mid-Term (weeks)Neutral to bullishReclaim $2.20–$2.40 to build momentumLong-Term (months+)Bullish if catalysts holdBreak $3.60 for extended trend higher
#MarketRebound #StrategyBTCPurchase #CPIWatch #WriteToEarnUpgrade