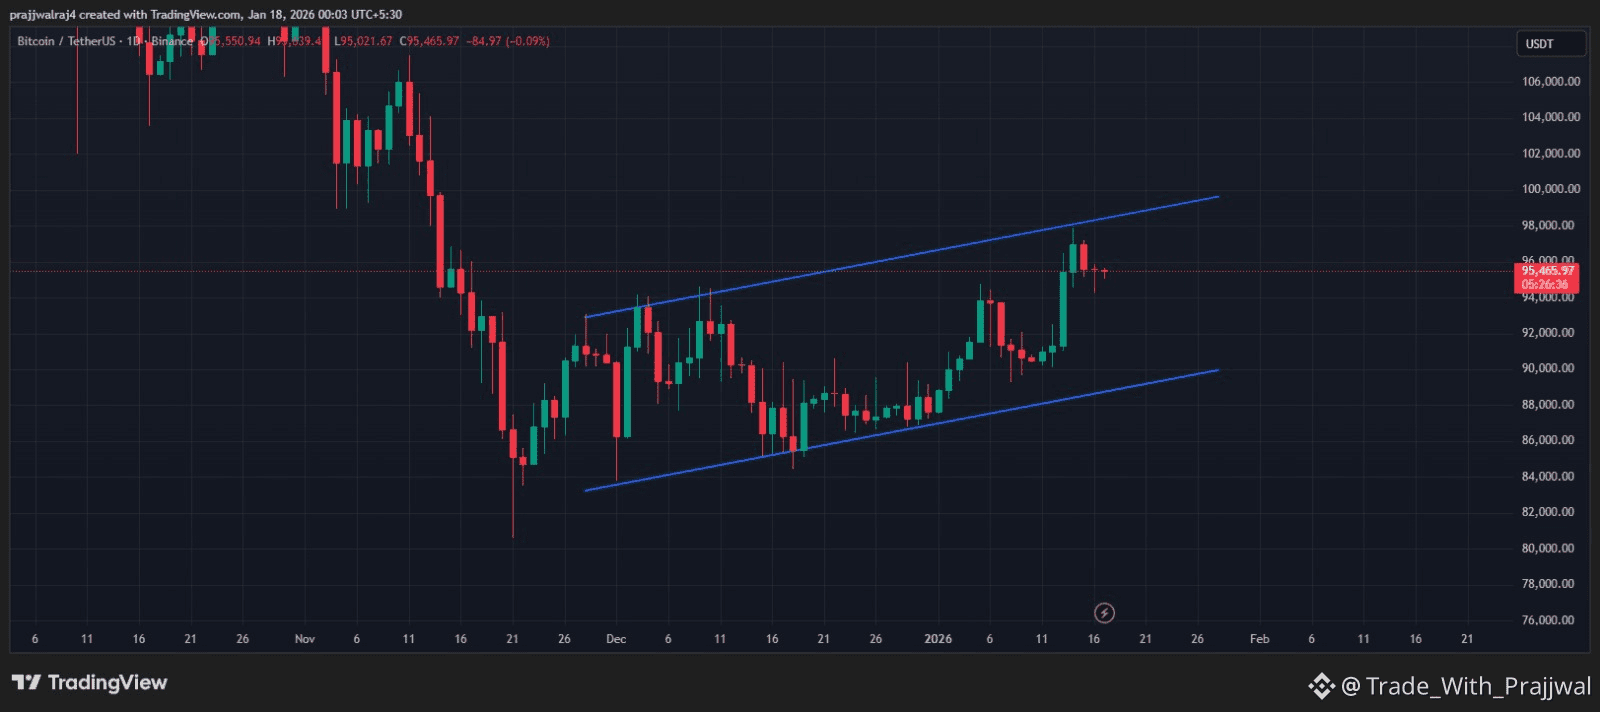
Bitcoin($BTC ) is currently trading around $95,465, moving within a rising parallel channel on the daily chart. This pattern has been respected multiple times, indicating that buyers and sellers both are following these key trendlines closely.
In the last few sessions, BTC faced resistance near the upper trendline around $97,500–$98,000, showing some short-term profit booking. As long as Bitcoin holds above the $94,000–$93,500 support zone, the uptrend structure remains intact.
If the price bounces from current levels, we could see another attempt toward the upper boundary of the channel near $98,000–$99,000 in the next 1–2 days. However, a breakdown below $93,500 could trigger short-term weakness, possibly retesting $91,000–$90,000.
In summary:
📈 Bullish scenario: Bounce from support → move toward $98K–$99K
📉 Bearish scenario: Breakdown below $93.5K → decline toward $91K–$90K
⚠️ Volatility expected: Traders should watch price reaction around the midline of the channel
The next 48 hours are likely to decide whether BTC continues its steady climb or takes a short-term breather within the channel
#BTC100kNext? #MarketRebound #WriteToEarnUpgrade #StrategyBTCPurchase