$BTC Here’s a short technical overview of the SOL/USDT pair with visuals to help you see the key levels and current price context (based on recent market data and charts):

📊 Short SOL/USDT Technical Snapshot
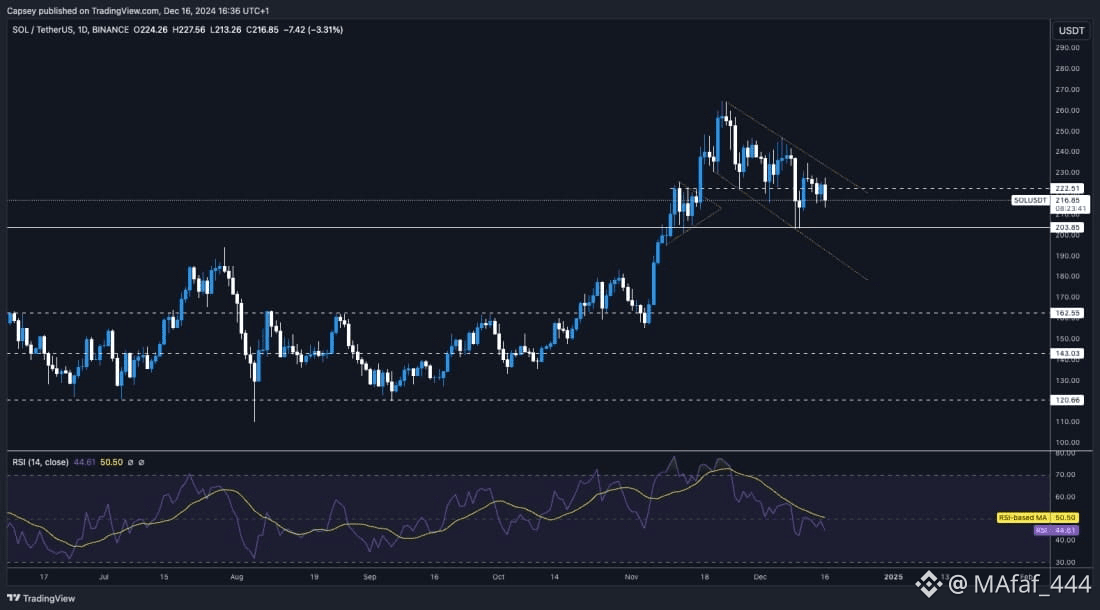
Current trend: Mixed to cautiously bullish, depending on timeframe. Price is oscillating around key support/resistance zones.
Key short-term levels (daily chart):
Support: ~$156–$160 — critical floor for near-term range trades.
Resistance: ~$162–$168 — reclaiming this zone would ease downside pressure.
Indicators:
RSI near neutral (~45) — not oversold/overbought, suggesting range-bound movement.
MACD slightly negative — intraday momentum weak, needs catalyst to flip bullish.
📈 Bullish Scenario
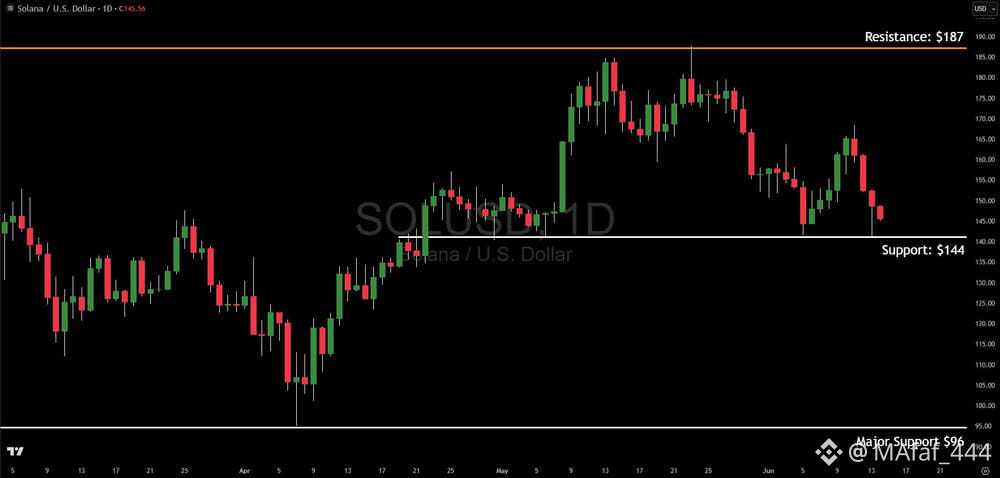
If SOL holds above ~$160 and breaks above ~$168–$175, buyers could push toward $185–$200+ next.
Recent chart studies show volatility picking up and potential breakout continuation if upper resistances are cleared.
📉 Bearish Risk
Failure to defend ~$156 support could lead to test of lower zones (~$130–$140).
Short-term technical models (e.g., certain AI forecasts) even foresee a possible ~20% drop toward lower support around $128–$130 if momentum turns negative.
🧠 Summary
Range-bound right now: price consolidating with key support near $156–$160, resistance near $168–$175.
Bullish continuation if buyers reclaim higher zones and sustain above resistance.
Bearish trigger on break below support could mean deeper pullback.
Not financial advice — this is technical context based on recent data and common indicators.