A Beginner’s Guide to Trading the Trend
If you’ve ever looked at a price chart and wondered “Is the market going up, down, or just moving sideways?” — then trend lines are exactly what you need.
A trend line is one of the most basic yet powerful tools in technical analysis. It helps traders understand market direction, identify key levels, and make better trading decisions.
Let’s break it down in a simple way.
What Is a Trend Line?
A trend line is a straight line drawn on a chart to connect important price points.
It visually shows the direction of the market trend.
Instead of guessing, trend lines allow traders to see whether buyers or sellers are in control.
Types of Trend Lines
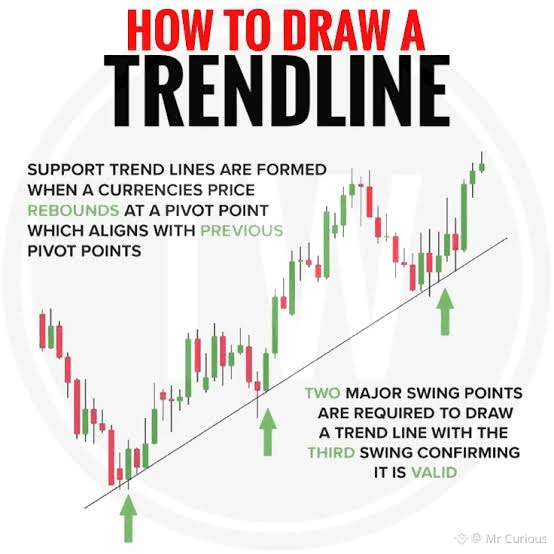
1️⃣ Uptrend Line (Bullish Trend)
Drawn by connecting higher lows
Shows that buyers are stepping in at higher prices
Acts as dynamic support
As long as price stays above the line, the trend remains bullish
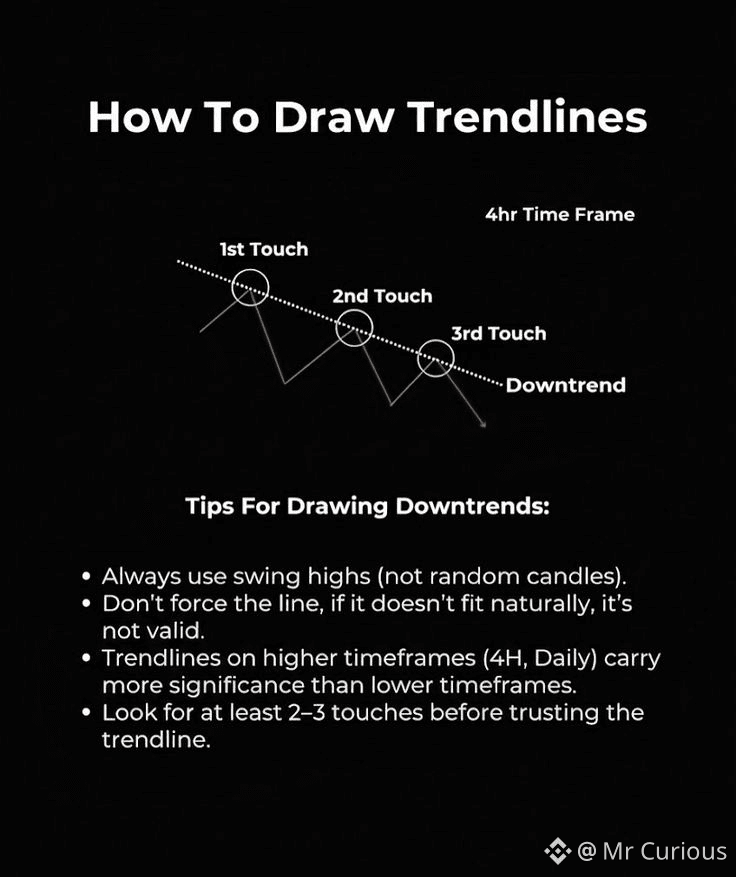
2️⃣ Downtrend Line (Bearish Trend)
Drawn by connecting lower highs
Indicates strong selling pressure
Acts as dynamic resistance
Price below the line means sellers are still in control
3️⃣ Sideways / Range Trend Line
Used when price moves in a range
Helps identify support and resistance zones
Common during consolidation phases
How to Draw a Trend Line Correctly
Many beginners draw trend lines incorrectly. Here’s how to do it the right way:
Use at least two clear touchpoints (three makes it stronger)
Prefer wicks over candle bodies
Don’t force the line to fit price
The more times price respects the line, the more reliable it becomes
A good trend line should look natural, not forced.
Why Trend Lines Are Important
Trend lines help traders:
Identify the overall trend
Spot pullbacks and entries
Detect trend breakouts or reversals
Trade with better risk-to-reward ratios
They act like dynamic support and resistance that move with price.
Trend Line Breaks: What Do They Mean?
When price breaks a trend line, it can signal:
Trend weakening
Potential reversal
Change in market structure
However, not every break is real.
That’s why confirmation is important.
Common Mistakes to Avoid
❌ Redrawing trend lines to match your bias
❌ Using trend lines alone without confirmation
❌ Trading every trend line break blindly
✔ Combine trend lines with:
Volume
RSI
Moving averages
Market structure
Final Thoughts
Trend lines don’t predict the future — they help you read the present.
They work best when combined with proper risk management and other technical tools. Mastering trend lines is often the first step toward becoming a disciplined and confident trader.
Remember:
👉 Trade with the trend, not against it.
If this helped you understand trend lines better, feel free to bookmark, comment, and follow for more simple crypto education.
#BinanceSquare #CryptoEducation #TechnicalAnalysis #Trendline


