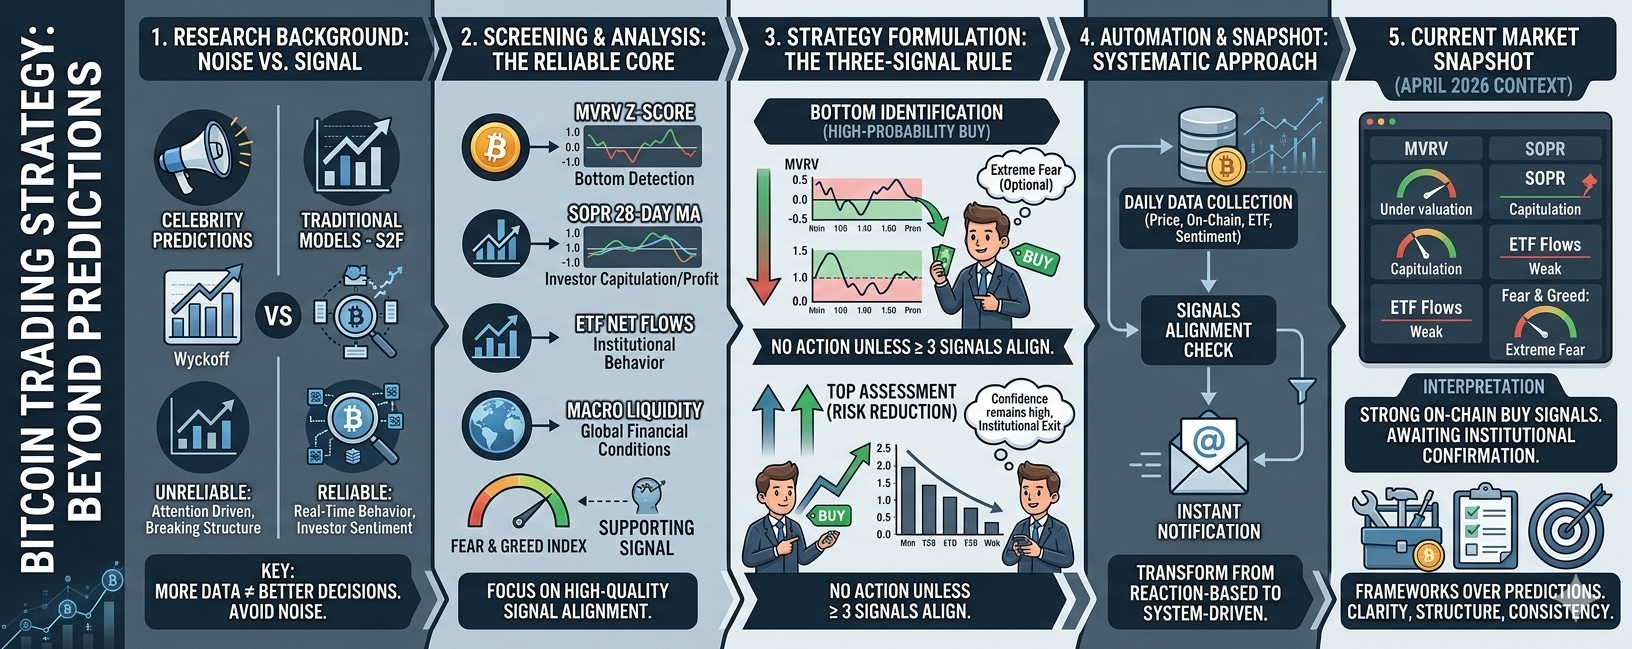
1. Research Background: Filtering Signal from Noise
When approaching Bitcoin trading as a non-professional trader, the first critical step is not choosing indicators—but understanding which types of data actually work.
After reviewing Bitcoin prediction methods from 2017 to 2025, most approaches fall into three categories:
1) Celebrity Predictions
High-profile forecasts often dominate headlines—$100K, $200K, even $500K targets. The issue isn’t intelligence; it’s incentives. Bold predictions generate attention, followers, and credibility if correct, while failures are quickly forgotten. Over time, these forecasts have shown large deviations, often exceeding 50%.
2) Traditional Analytical Models
Popular frameworks like Stock-to-Flow, Elliott Waves, Wyckoff, and cycle theories once showed strong historical alignment. However, many of these models began to break down after 2022. The reason is simple: market structure changed.
Bitcoin is no longer driven purely by supply dynamics—it is increasingly influenced by institutional capital flows.
3) On-Chain Data Metrics
Unlike predictions, on-chain metrics describe market behavior. Indicators like MVRV, SOPR, and NUPL provide insight into holder positioning and sentiment. These are not forecasts—they are real-time reflections of market conditions.
👉 Key realization:
More data does not mean better decisions. Too many conflicting signals can actually reduce clarity and lead to worse outcomes.
2. Screening and Analysis: What to Keep vs. What to Ignore
After filtering through dozens of indicators, the strategy simplifies into two groups:
❌ Unreliable Inputs (Discarded)
Celebrity forecasts → Driven by attention, not accuracy
Pure Stock-to-Flow models → Broken by post-ETF market dynamics
Standalone sentiment indicators → Too many false signals when used alone
✅ Reliable Core Indicators (Retained)
1) MVRV Z-Score (Bottom Detection Tool)
Measures how far current price deviates from average holder cost.
Green zone historically = strong accumulation opportunity
Accurate for bottoms, less reliable for tops after ETF adoption
2) SOPR (28-Day Moving Average)
Tracks whether coins are sold at profit or loss
Below 1.0 = investors capitulating (selling at loss)
Consistently reliable for identifying market bottoms
3) ETF Net Flows (Post-2024 Critical Indicator)
Represents institutional behavior
Sustained inflows → accumulation
Sustained outflows → distribution
4) Macro Liquidity (Big Picture Filter)
Easing (rate cuts, liquidity expansion) → bullish environment
Tightening (rate hikes, contraction) → risk-off environment
5) Fear & Greed Index (Supporting Signal Only)
Extreme fear (<20) adds weight to bullish setups
Should never be used in isolation
👉 Final insight:
Only a small number of high-quality signals outperform a large number of weak ones.
3. Strategy Formulation: The “Three-Signal Rule”
The core philosophy of this strategy is simple:
Don’t predict price targets—identify direction and positioning.
Instead of reacting to single indicators, the system requires multi-signal confirmation.
🔻 Bottom Identification (High-Probability Buy Zone)
Triggered when:
MVRV enters green zone
SOPR drops below 1.0
Fear & Greed shows extreme fear (optional booster)
👉 Interpretation:
Market participants are capitulating → historically strong buying opportunities.
🔺 Top Assessment (Risk Reduction Zone)
Triggered when:
On-chain signals remain strong
ETF flows show consistent outflows
👉 Interpretation:
Retail confidence remains high, but institutions are exiting.
🌍 Macro Overlay (Context Filter)
Easing cycle → Increase exposure
Tightening cycle → Reduce exposure
👉 This prevents fighting the broader economic trend.
⚖️ Execution Rule
No action is taken unless at least 3 signals align.
This eliminates:
Emotional trades
Noise-based decisions
Overtrading
4. Automation: Turning Strategy into a System
To remove human bias, this framework can be automated:
Daily data collection (price, on-chain metrics, ETF flows, sentiment)
No alerts unless conditions are met
Instant notification when signals align
👉 This transforms trading from reaction-based to system-driven.
5. Current Market Snapshot (April 2026 Context)
At the latest evaluation:
Extreme fear is present
MVRV indicates undervaluation
SOPR confirms capitulation
ETF flows remain weak
👉 Interpretation:
Strong on-chain buy signals exist, but institutional confirmation is missing.
Historically, similar setups have only occurred a few times—and were followed by major upside over the next 6–12 months.
6. Final Insight: Framework Over Predictions
The biggest takeaway is not about Bitcoin—it’s about decision-making.
Predictions are opinions
Frameworks are tools
If a prediction fails, nothing is learned.
If a framework fails, it can be refined and improved.
This strategy doesn’t promise exact price targets.
It provides something more valuable: clarity, structure, and consistency.
Conclusion
In a market full of noise, simplicity wins.
By focusing on just four key dimensions—on-chain behavior, institutional flows, macro conditions, and sentiment—you can build a system that adapts to changing market structures rather than breaking under them.
The goal isn’t to be right every time.
The goal is to act only when probability is on your side.
Bitcoin Trading Strategy Breakdown: Why Most Predictions Fail — And What Actually Works
1. Research Background: Filtering Signal from Noise
When approaching Bitcoin trading as a non-professional trader, the first critical step is not choosing indicators—but understanding which types of data actually work.
After reviewing Bitcoin prediction methods from 2017 to 2025, most approaches fall into three categories:
1) Celebrity Predictions
High-profile forecasts often dominate headlines—$100K, $200K, even $500K targets. The issue isn’t intelligence; it’s incentives. Bold predictions generate attention, followers, and credibility if correct, while failures are quickly forgotten. Over time, these forecasts have shown large deviations, often exceeding 50%.
2) Traditional Analytical Models
Popular frameworks like Stock-to-Flow, Elliott Waves, Wyckoff, and cycle theories once showed strong historical alignment. However, many of these models began to break down after 2022. The reason is simple: market structure changed.
Bitcoin is no longer driven purely by supply dynamics—it is increasingly influenced by institutional capital flows.
3) On-Chain Data Metrics
Unlike predictions, on-chain metrics describe market behavior. Indicators like MVRV, SOPR, and NUPL provide insight into holder positioning and sentiment. These are not forecasts—they are real-time reflections of market conditions.
👉 Key realization:
More data does not mean better decisions. Too many conflicting signals can actually reduce clarity and lead to worse outcomes.
2. Screening and Analysis: What to Keep vs. What to Ignore
After filtering through dozens of indicators, the strategy simplifies into two groups:
❌ Unreliable Inputs (Discarded)
Celebrity forecasts → Driven by attention, not accuracy
Pure Stock-to-Flow models → Broken by post-ETF market dynamics
Standalone sentiment indicators → Too many false signals when used alone
✅ Reliable Core Indicators (Retained)
1) MVRV Z-Score (Bottom Detection Tool)
Measures how far current price deviates from average holder cost.
Green zone historically = strong accumulation opportunity
Accurate for bottoms, less reliable for tops after ETF adoption
2) SOPR (28-Day Moving Average)
Tracks whether coins are sold at profit or loss
Below 1.0 = investors capitulating (selling at loss)
Consistently reliable for identifying market bottoms
3) ETF Net Flows (Post-2024 Critical Indicator)
Represents institutional behavior
Sustained inflows → accumulation
Sustained outflows → distribution
4) Macro Liquidity (Big Picture Filter)
Easing (rate cuts, liquidity expansion) → bullish environment
Tightening (rate hikes, contraction) → risk-off environment
5) Fear & Greed Index (Supporting Signal Only)
Extreme fear (<20) adds weight to bullish setups
Should never be used in isolation
👉 Final insight:
Only a small number of high-quality signals outperform a large number of weak ones.
3. Strategy Formulation: The “Three-Signal Rule”
The core philosophy of this strategy is simple:
Don’t predict price targets—identify direction and positioning.
Instead of reacting to single indicators, the system requires multi-signal confirmation.
🔻 Bottom Identification (High-Probability Buy Zone)
Triggered when:
MVRV enters green zone
SOPR drops below 1.0
Fear & Greed shows extreme fear (optional booster)
👉 Interpretation:
Market participants are capitulating → historically strong buying opportunities.
🔺 Top Assessment (Risk Reduction Zone)
Triggered when:
On-chain signals remain strong
ETF flows show consistent outflows
👉 Interpretation:
Retail confidence remains high, but institutions are exiting.
🌍 Macro Overlay (Context Filter)
Easing cycle → Increase exposure
Tightening cycle → Reduce exposure
👉 This prevents fighting the broader economic trend.
⚖️ Execution Rule
No action is taken unless at least 3 signals align.
This eliminates:
Emotional trades
Noise-based decisions
Overtrading
4. Automation: Turning Strategy into a System
To remove human bias, this framework can be automated:
Daily data collection (price, on-chain metrics, ETF flows, sentiment)
No alerts unless conditions are met
Instant notification when signals align
👉 This transforms trading from reaction-based to system-driven.
5. Current Market Snapshot (April 2026 Context)
At the latest evaluation:
Extreme fear is present
MVRV indicates undervaluation
SOPR confirms capitulation
ETF flows remain weak
👉 Interpretation:
Strong on-chain buy signals exist, but institutional confirmation is missing.
Historically, similar setups have only occurred a few times—and were followed by major upside over the next 6–12 months.
6. Final Insight: Framework Over Predictions
The biggest takeaway is not about Bitcoin—it’s about decision-making.
Predictions are opinions
Frameworks are tools
If a prediction fails, nothing is learned.
If a framework fails, it can be refined and improved.
This strategy doesn’t promise exact price targets.
It provides something more valuable: clarity, structure, and consistency.
Conclusion
In a market full of noise, simplicity wins.
By focusing on just four key dimensions—on-chain behavior, institutional flows, macro conditions, and sentiment—you can build a system that adapts to changing market structures rather than breaking under them.
The goal isn’t to be right every time.
The goal is to act only when probability is on your side.