
In-depth data, including all metric breakdowns and visual trend analysis, is available in the full infographic. The information below is an executive summary of the on-chain panorama.
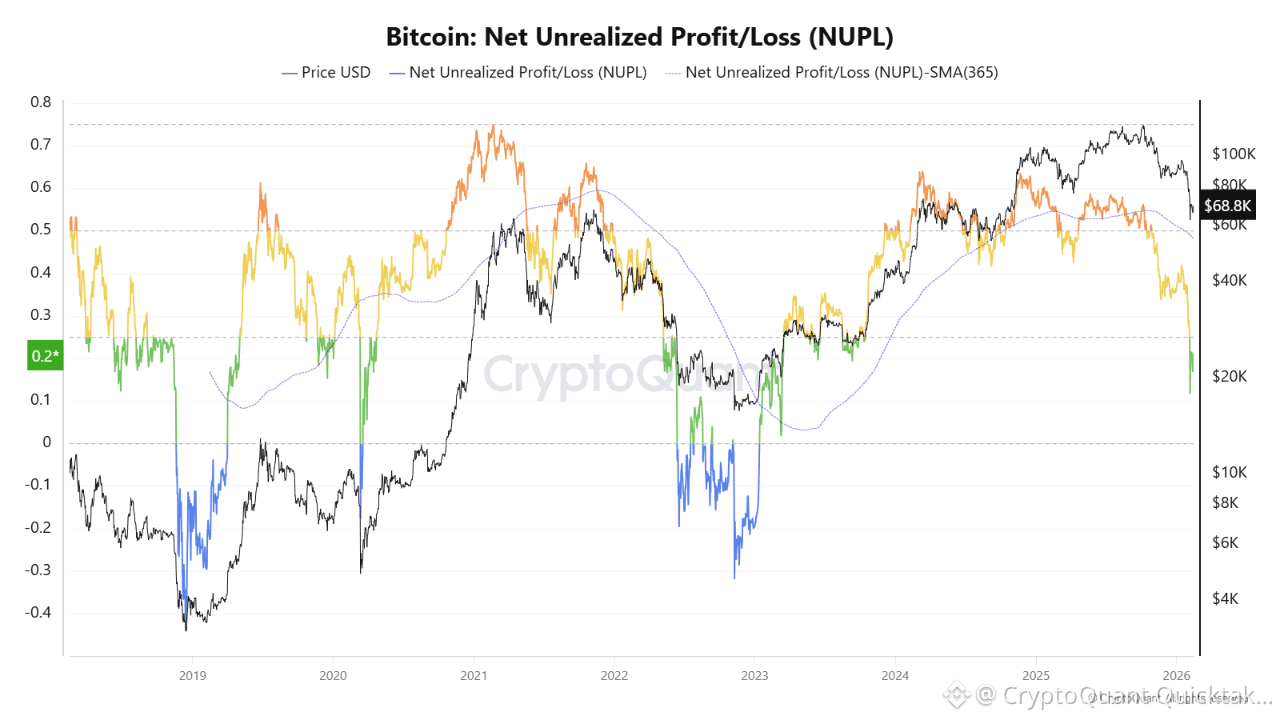
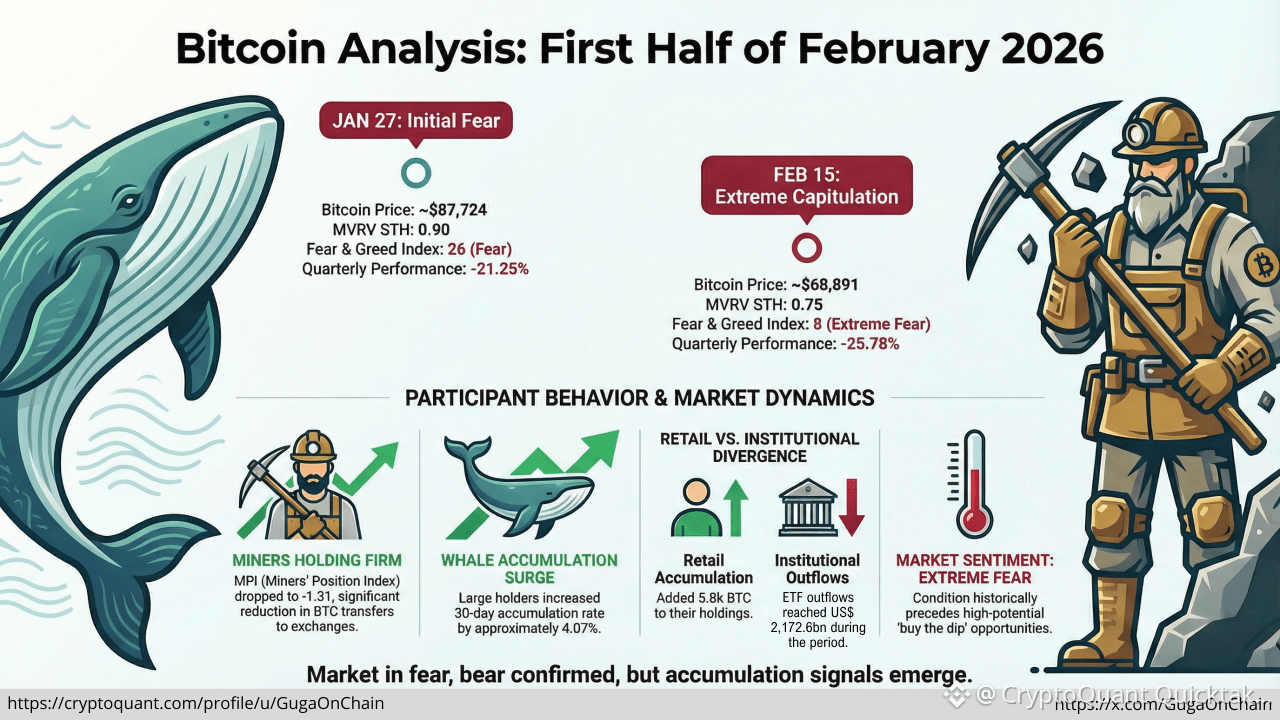
The opening of February 2026 serves as a stark map of institutional exhaustion. As Bitcoin navigated a treacherous 50% decline, the on-chain diagnosis grew increasingly grim: NUPL registering 21.30% in the fear region is a portrait of this first half of February for Bitcoin. A Fear & Greed Index of 8.0 confirms a state of extreme panic, fueled by significant macroeconomic uncertainty and specific operational shifts to be monitored.
METRICS
◾ ETFs → Net outflow of $2.172 billion in the period.
◾ Supply → 42.85% of the supply in a state of loss, highlighting the phase of critical stress.
◾ Quarterly Price Performance → -25.78% so far, with no prospect of recovery for this quarter.
◾ Growth Rate → BTC (-19.10%) / Top 20 (-12.48%) / Mid-Small (-18.30%) , making the contraction in the crypto economy evident.
◾ Demand from Accumulator Addresses → On the other hand, demand from accumulators is strong: 380,104 BTC over the last 30 days.
◾ Miners → With an MPI of -1.31, it suggests accumulation (HODLing), as AI revenues cushion operations.
CONCLUSION
Bitcoin's 50% collapse toward the 200-period moving average on the weekly timeframe — which coincides with the region of its realized price at $55,800 — will be a significant test, besides being seen by analysts as a region conducive to accumulation. However, the turn toward recovery now depends on investor resilience.
Written by GugaOnChain
