$GBP /JPY holds steady as traders eye BoE and BoJ rate decisions
GBP/JPY range-bound near 212.00 as markets await BoE and BoJ monetary policy decisions.
UK-Japan interest rate differential continues to support an upside bias in the cross.
Technically, GBP/JPY holds above key moving averages, with a bearish flag in play but near-term momentum remaining positive.
The British Pound (GBP) trades broadly flat against the Japanese Yen (JPY) on Tuesday as a thin economic calendar keeps price action subdued, with attention firmly shifting to the Bank of England (BoE) and Bank of Japan (BoJ) interest rate decisions due on Thursday. At the time of writing, GBP/JPY trades around 212.15, holding close to the previous day’s high.
On the macro front, the wide interest rate differential between the UK and Japan continues to support an upside bias in GBP/JPY. The recent surge in Oil prices, driven by disruptions in the Strait of Hormuz amid the US–Iran war, is reinforcing inflation concerns and prompting a hawkish repricing of BoE rate expectations, providing additional support to the cross.
However, the BoJ faces a challenging backdrop, as persistent inflation may support further policy tightening, while higher energy costs could weigh on Japan’s economic growth given its status as a major energy importer, clouding the outlook.
Nevertheless, both central banks are widely expected to keep rates unchanged at their upcoming meetings, with markets likely to focus on forward guidance for clues on how policymakers assess the economic impact of rising Oil prices.
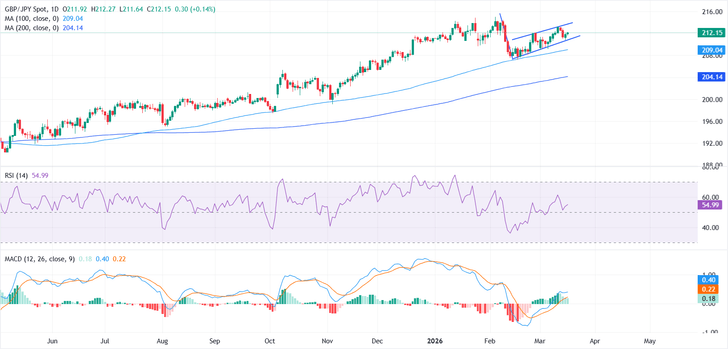
From a technical perspective, GBP/JPY appears to be forming a bearish flag pattern on the daily chart. However, the near-term bias remains tilted to the upside as the pair holds comfortably above the rising 100- and 200-day Simple Moving Averages (SMAs)
The Relative Strength Index (RSI) at 54 stays above its midline, suggesting moderate bullish momentum. The Moving Average Convergence Divergence (MACD) line remains above the Signal line in positive territory, with a still-positive histogram that supports persistent, if measured, buying pressure.
On the downside, a clear break below the lower boundary of the flag near the 211.00-210.50 region could expose the 100-day SMA around 209.00, followed by the 200-day SMA near 204.14. On the upside, initial resistance is seen near 213.00, close to the upper boundary of the flag, with a sustained break opening the door toward the 215.00 area, the February 4 high.