To grasp the real capital movements in the crypto market, it's a must to raise your gaze and step back from those minute charts. When analyzing Chainlink's ($LINK ) historical behavior on a weekly timeframe, a super clean and solid macro accumulation structure is revealed.

While the average trader gets spooked by small daily price fluctuations, the big players leverage those periods of sideways action to build their positions for the medium and long term without making a fuss.
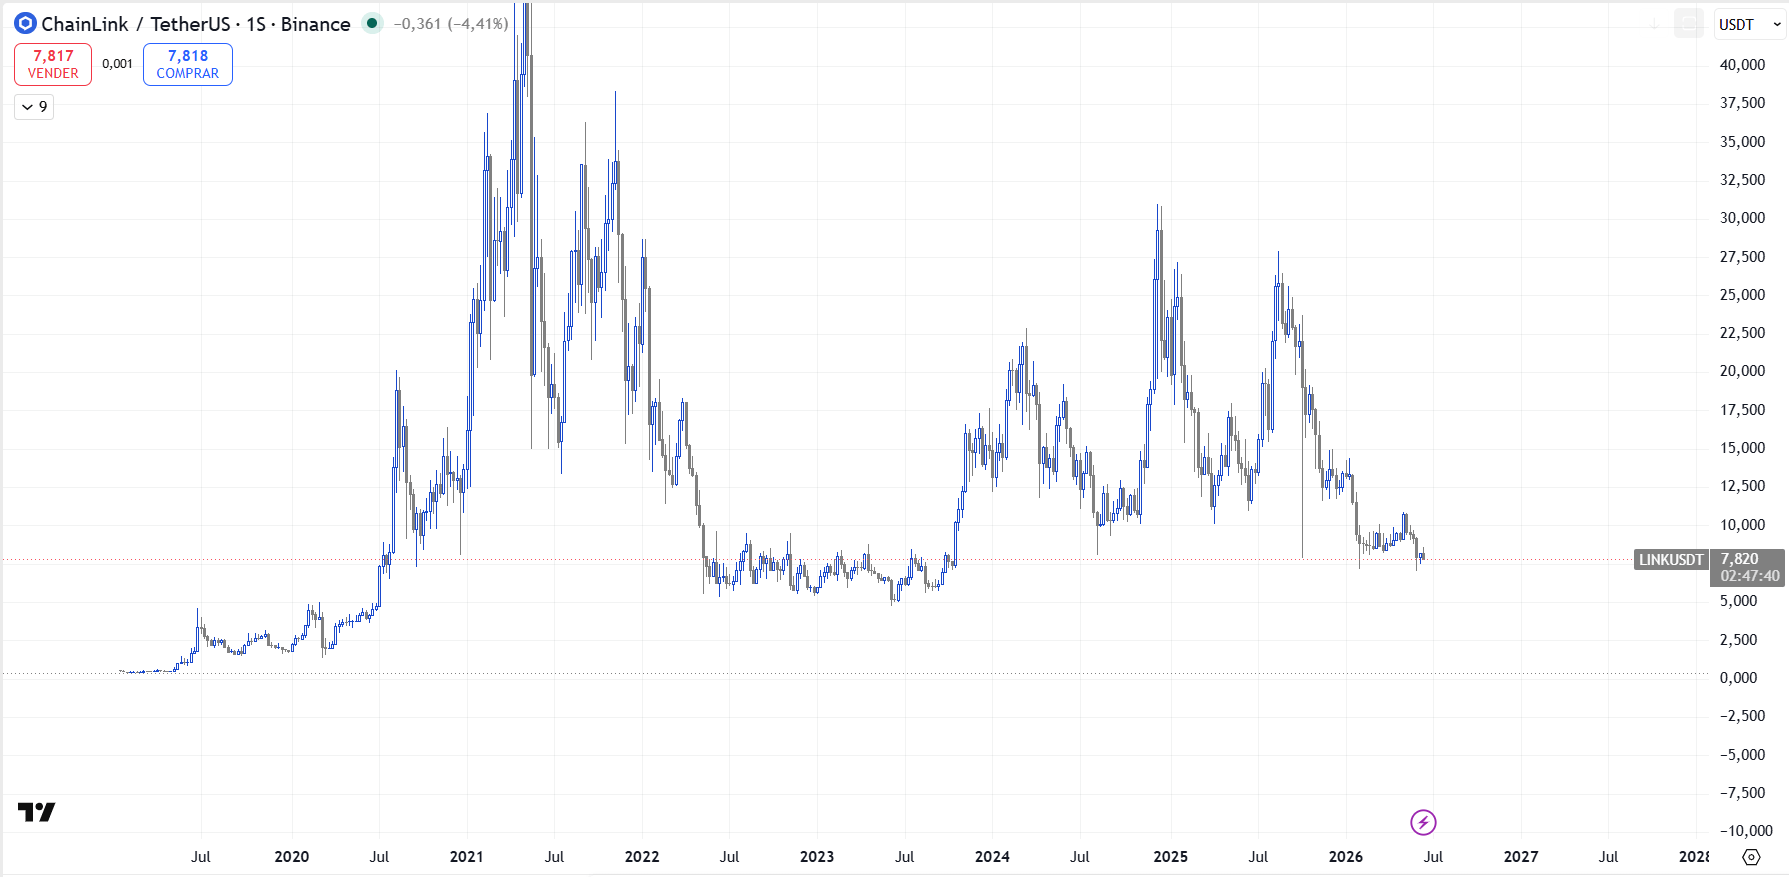
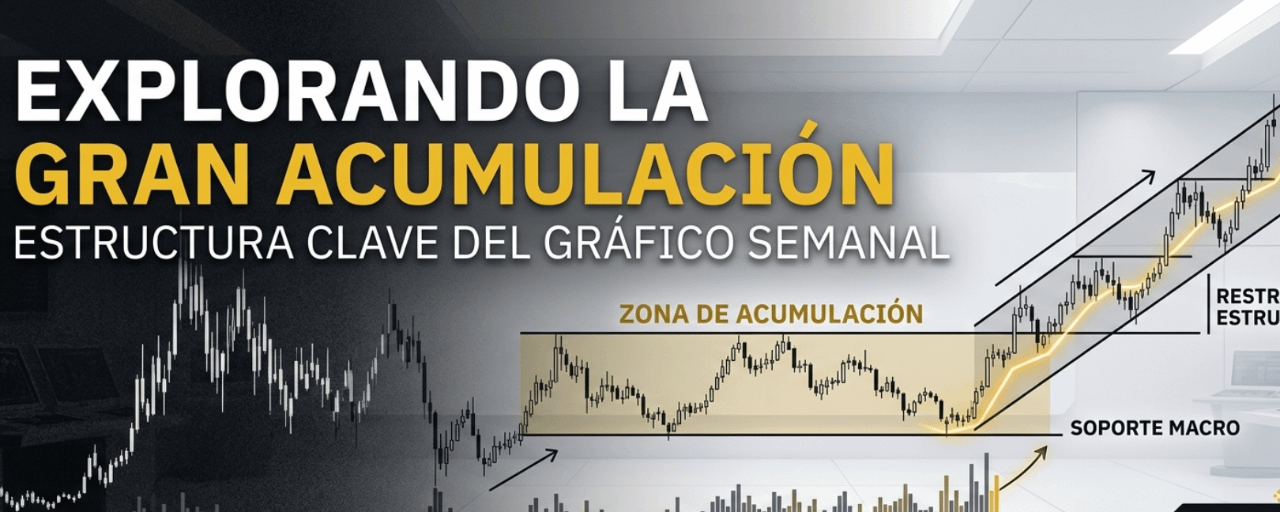
The weekly chart of LINK shows us a flawless mathematical confluence: the price has historically respected a structural demand zone that acts as a very strong dynamic floor. This prolonged price compression often precedes the most significant expansion moves of the year.
The secret to surviving in this environment isn't about guessing where the price will go tomorrow, but rather identifying these high-probability zones on larger charts and having the necessary patience to let the structure develop freely.