
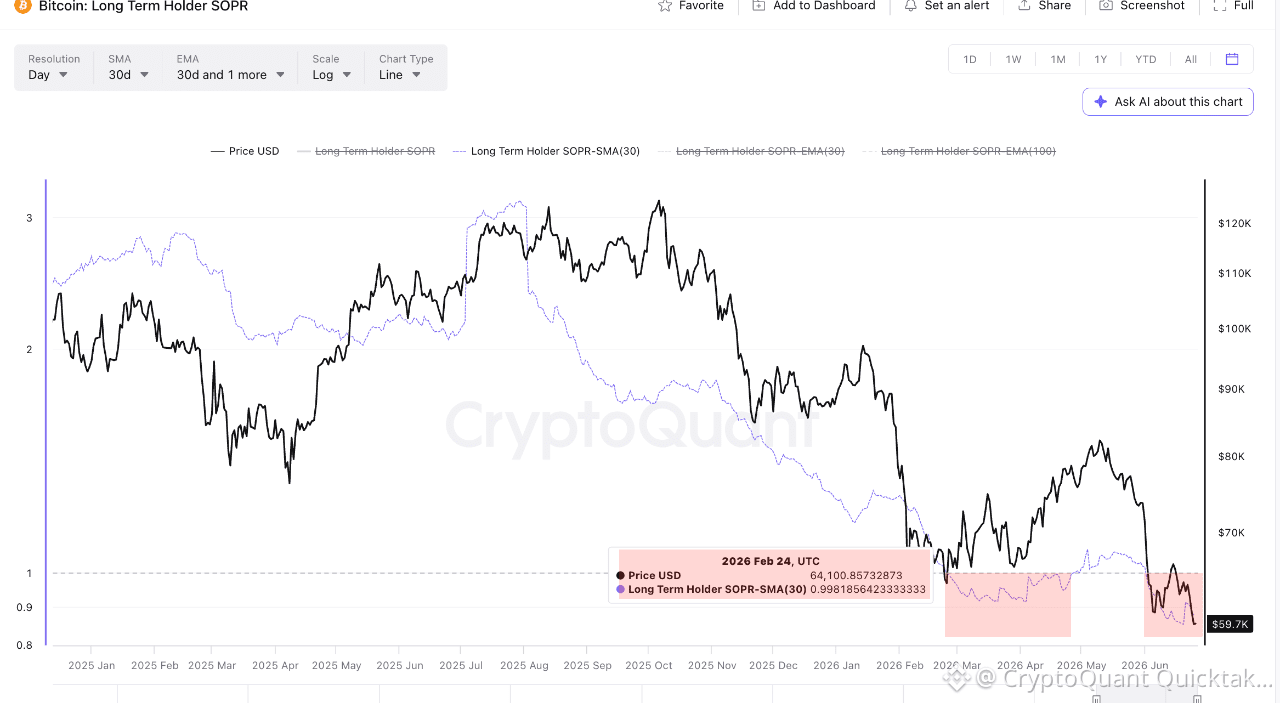
Bitcoin's Long-Term Holder SOPR (30-day average) is 0.88, below the break-even line of 1.0. It has printed below 1 on 87 of the 176 days so far in 2026, in two stretches (Feb 24 to Apr 27, then since Jun 2), the current run at 24 sessions.
📊 What this measures
Long-Term Holder SOPR tracks whether coins untouched for 6+ months are moving at a profit or a loss.
Above 1.0 = those holders sell for more than they paid. Below 1.0 = they sell at a loss.
Read the 30-day average, not the daily value: few old coins move per day, so one wallet can swing the daily reading from 0.87 to 2.67 and back. (Figure computed as a 30-day moving average on CryptoQuant's daily series.)
🔍 Why it matters
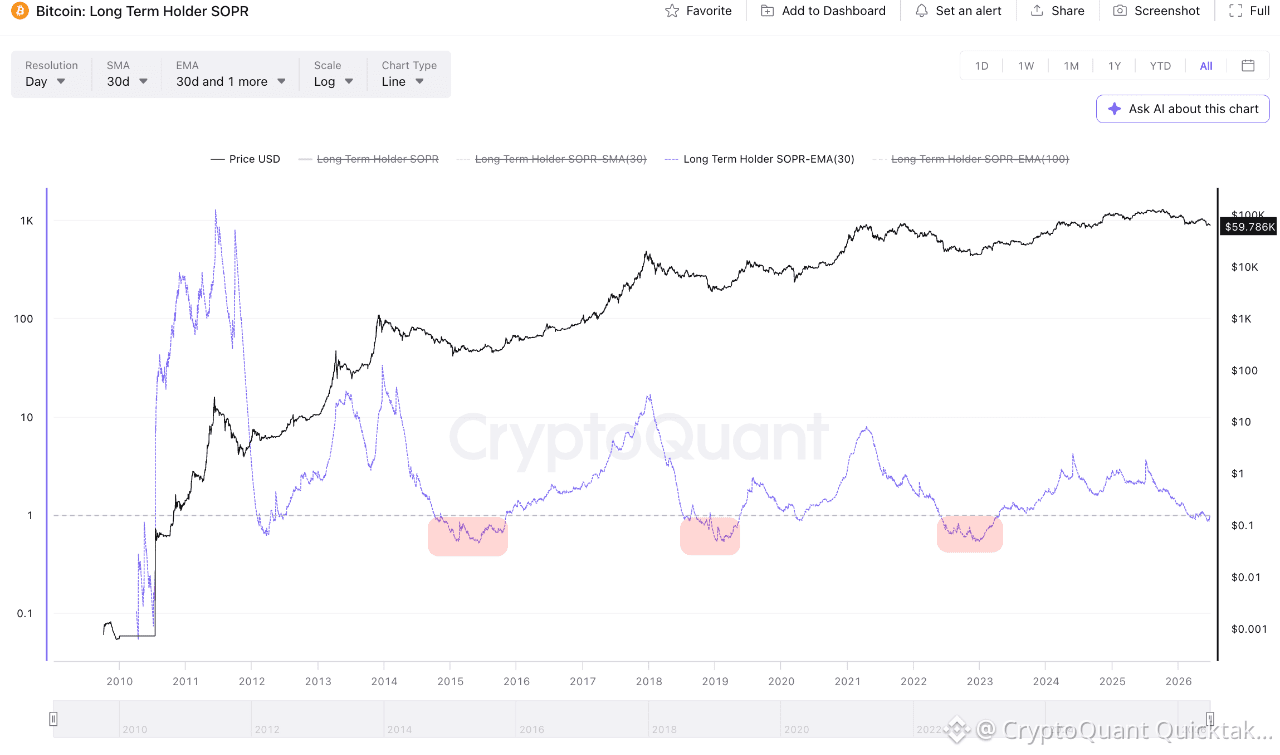
A sustained 30-day average below 1 has only appeared in the bear markets of 2015, 2018-19 and 2022-23, plus the March 2020 COVID crash.
It did not appear in 2017, 2021, 2024 or 2025. Not one bull year.
The signal holds with both a simple and an exponential 30-day average.
Valuation is already at a cycle floor: MVRV 1.14, NUPL 0.12 (both valuation gauges), BTC near $60K, about 52% below its October 2025 peak of $124,710.
⚠️ What it does NOT say
Not a price forecast. In 2023 price rose while the average stayed below 1 for 100+ days, because long-term holders' cost basis sat at the 2021 top. The metric tracks supply under water, not price direction.
Spending below cost is realization, not proof of selling on exchanges. It can be off-exchange movement too.
⏳ The takeaway
The market is watching ETF demand. The quieter signal is on the supply side: the strongest hands have spent half a year underwater. The regime stays intact while the 30-day average holds below 1; it breaks if the average closes back above 1.0 for 5+ sessions. The question is whether six months of holders underwater is late-cycle capitulation or a floor forming.
Written by thechessONCHAIN