As of January 6, 2026, the market performance for RaveDAO (RAVE) shows a period of cooling after its explosive December rally. After reaching local highs, the coin is currently navigating a significant technical correction.
Daily Price Snapshot
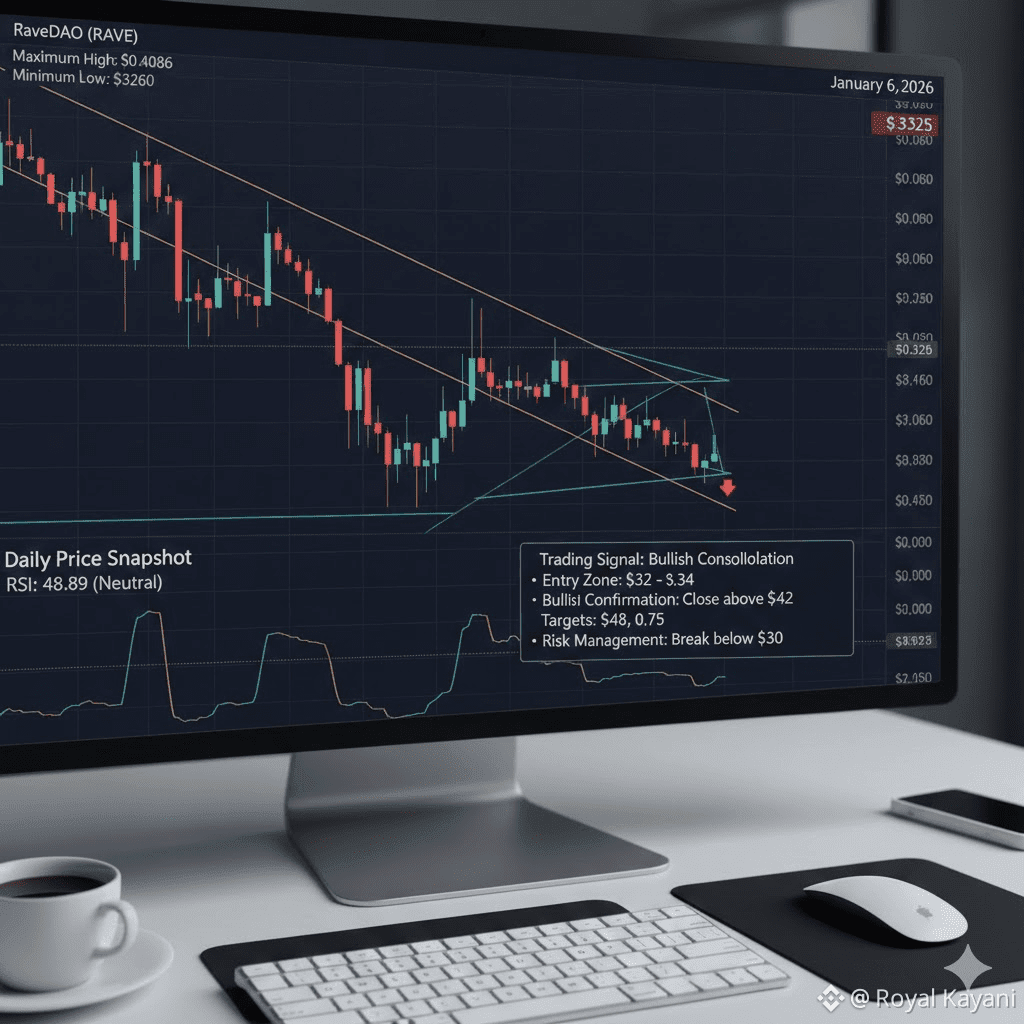
The 24-hour trading window has seen RAVE fluctuating within a defined range. The maximum high reached today was $0.4086, while the minimum low dipped to $0.3260. This price action reflects a broader -3.13% decline over the last day, as the asset struggles to maintain its footing above the psychological support level of $0.40.
Market Sentiment & Technicals
The Relative Strength Index (RSI) is currently sitting near 48.89, placing the coin in neutral territory. It is neither oversold nor overbought, suggesting that the current downtrend is driven by a lack of immediate buying catalysts rather than panic selling. The conclusion of major trading competitions on exchanges like Binance Alpha today may also contribute to short-term volatility as participants adjust their positions.
Trading Signal: Bullish Consolidation
Despite the recent dip, technical analysts identify a "Falling Wedge" pattern on the 4-hour chart. This structure typically signals seller exhaustion and often precedes a breakout.
• Entry Zone: Consider entries between $0.32 and $0.34 if support holds.
• Bullish Confirmation: A clean break and close above $0.42 is required to invalidate the current bearish momentum.
• Targets: If a breakout occurs, the next major resistance levels sit at $0.48, with a secondary long-term target of $0.75.
• Risk Management: A break below the $0.30 support could trigger further algorithmic selling toward the $0.22 level.
#RAVEUSDT #cryptosignals #TrendingTopic #altcoins #BinanceSquare
