
Don't be fooled by the candlestick! Behind the gradual decline of VANRY lies a shocking 20 million-level 'bloody' accumulation. One trick teaches you how to extract teeth from the tiger's mouth on the left!
Retail investors look at candlesticks, while the main players look at liquidity. Recently, VANRY's performance has been weak, with a bearish arrangement of moving averages on the 4-hour level. The current price is around 0.0058, and it seems to be on the verge of collapse. Many are asking if it is going to zero?
If you only look at candlesticks, you are likely in a panic and cutting losses. However, when we delve into the underlying trading data, we discover a chilling truth: the main players are taking advantage of the panic, frantically devouring blood-soaked chips!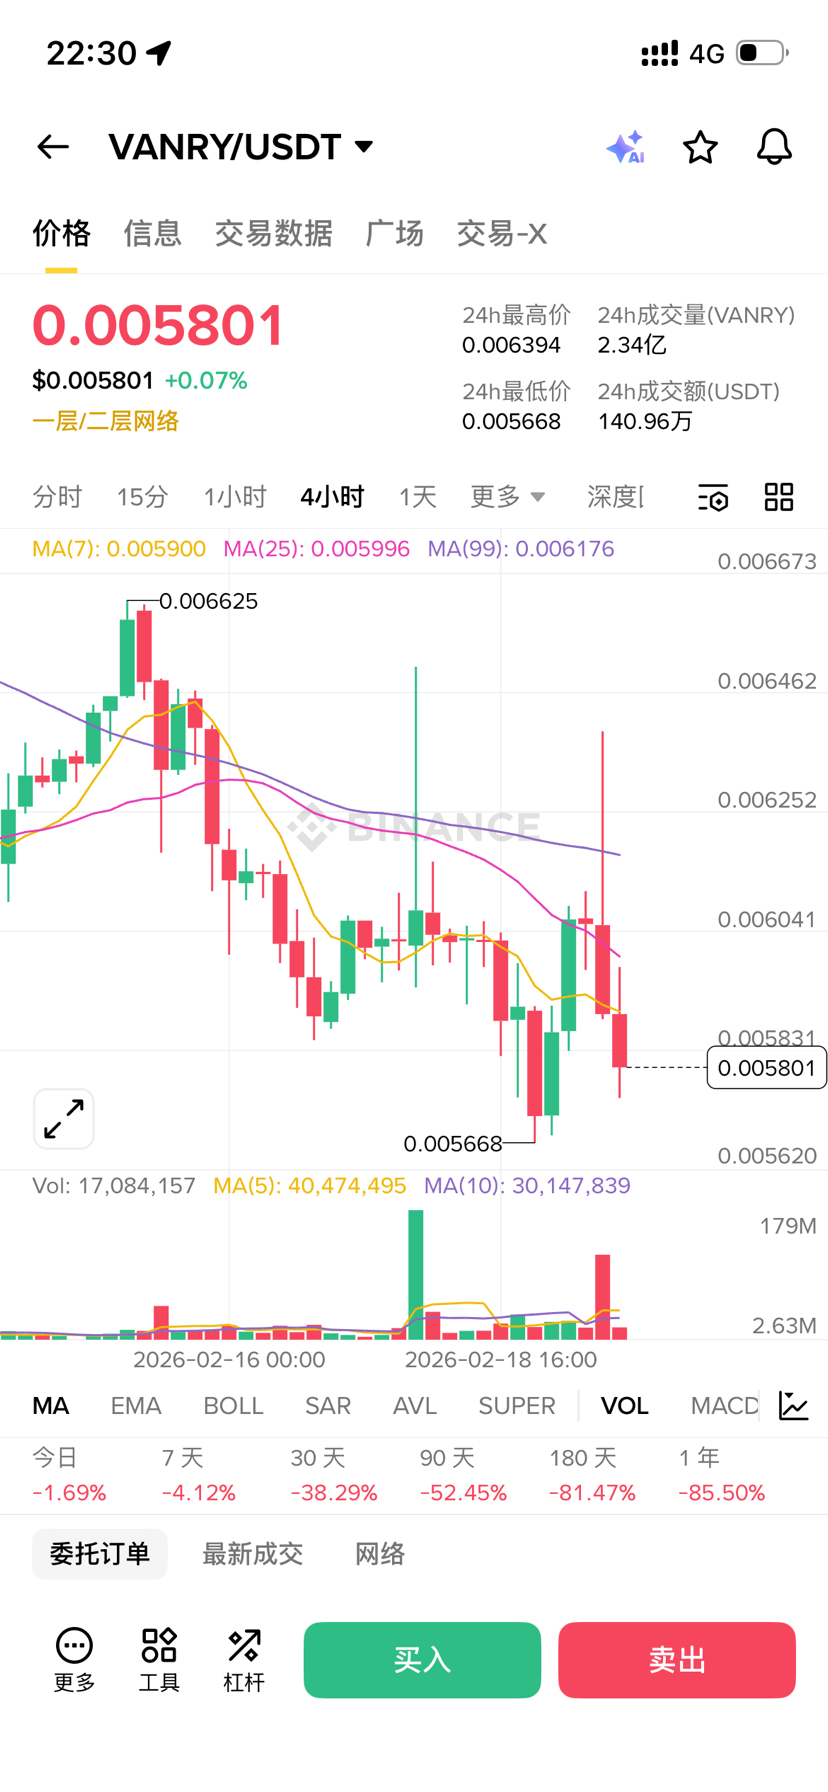
Today's hardcore investment research will help you peel back the surface of the market and find high-probability sniping points amidst the main force's washout. It is recommended to bookmark this and strictly follow the discipline!
🔍 Penetrating the superficial: A big reveal of the main force's hidden cards
1. Price decline vs. capital surge (extreme divergence)
The candlestick is falling, but the capital flow chart reveals ambition. In the past 24 hours, VANRY had a net inflow of large orders up to 21.72 million! What does this mean? When retail investors are desperately selling, the main institutions are densely placing buy orders below, like a giant whale opening its mouth to swallow everything. A typical characteristic of 'price drop and volume increase' left-side accumulation!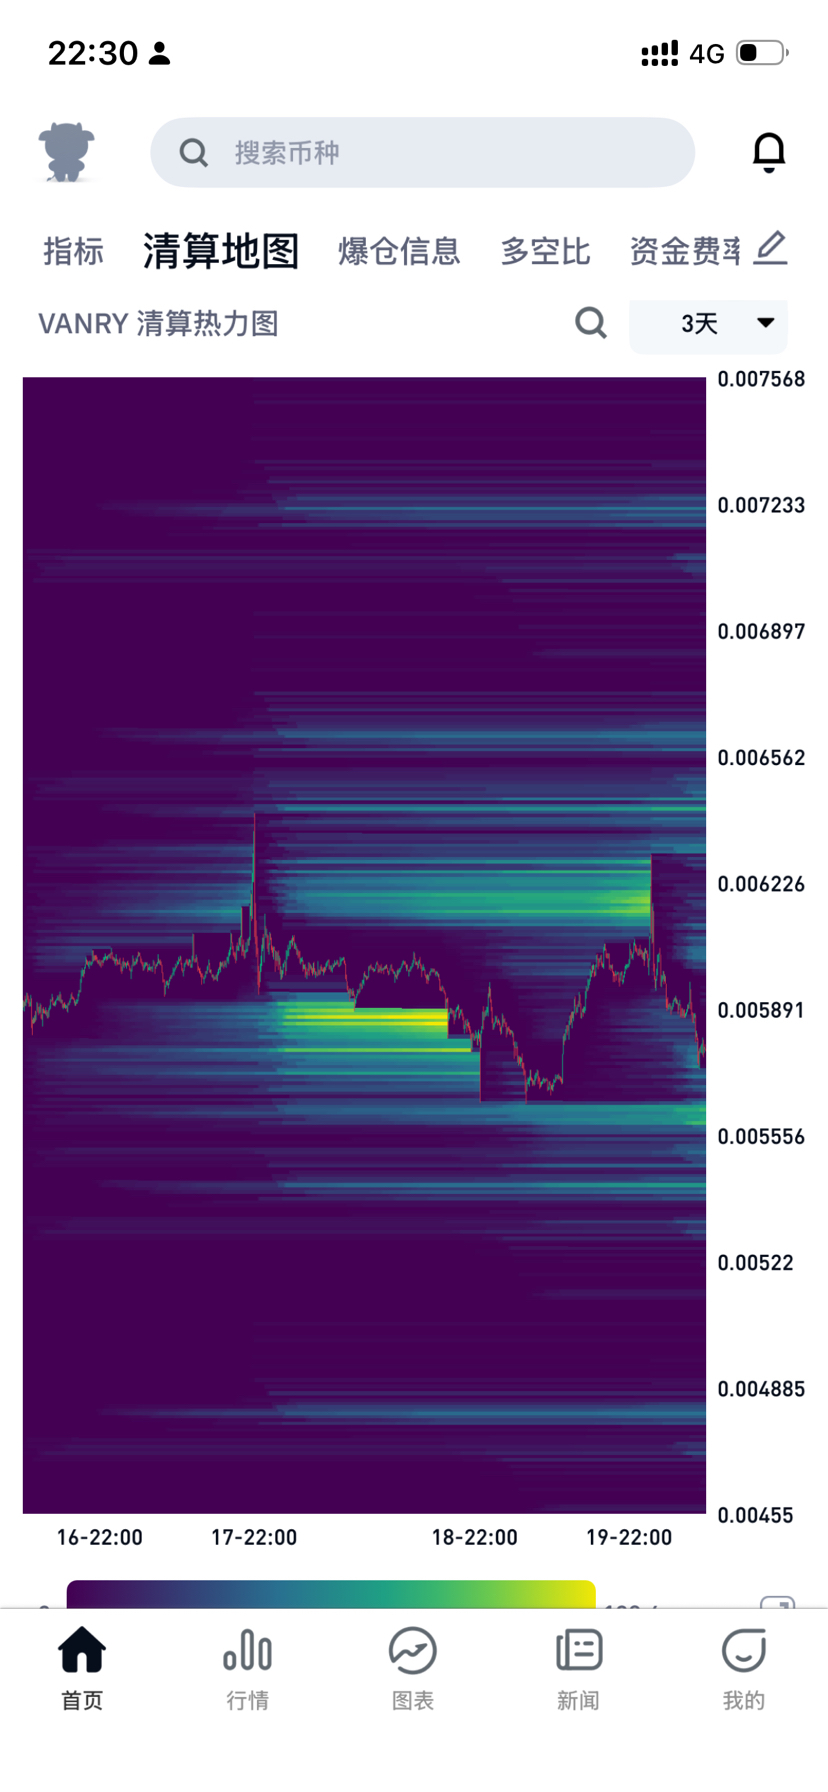
2. Liquidation map: The main force's 'hunting list'
Why doesn’t the main force push up now? Just look at the liquidation heat map to understand. In the range of 0.0055 - 0.0057, a massive accumulation of long stop-loss orders and liquidation lines (bright yellow/green band) has piled up.
Smart capital often first 'inserts a poisonous needle' downwards before launching the main upward wave, accurately sweeping away this liquidity. This is called 'liquidity sweep'—it can wash away the unsteady passengers on board while acquiring the cheapest chips.
3. Long-short ratio differentiation: Retail investors are fleeing, while major players are laughing
The current overall long-short ratio has dropped below 1, retail investors are chasing shorts; while Binance's major players maintain a high long-short ratio above 1.3. The chips are transferring from panicking retail investors to calm major players.
🎯 Tooth extraction from a tiger's mouth: 3-day high leverage contract sniping strategy
Since we understand the main force's 'sweep' script, we will never open a position at the current (0.0058) awkward level. Our strategy is: set a trap on the left side and wait for the spike!
⚠️ Core discipline: High leverage contracts (10x-20x per position) have zero tolerance for errors, total position control at 2%-5%, never hold on to losing positions!
• 📍 Ambush area (Entry): 0.005520 - 0.005680
• Partial orders: Don’t go all in! Place staggered buy orders at 0.005650 (breaking the previous low panic point), 0.005580, 0.005520 (heat map extreme value zone). Wait for the needle to come to you.
• 🛑 Steel stop-loss (Stop Loss): 0.005400
• Breaking below the heat map baseline without a recovery indicates that the accumulation logic has failed (or there is a systemic market crash). Mechanical stop-loss, safety first!
• 💰 Partial take profit (Take Profit):
• TP1 (0.005900): Pullback to the moving average, close 50% to secure profits, and push the remaining position to protect against losses.
• TP2 (0.006250): Resistance zone, close 30% to secure profits.
• TP3 (0.006400+): Keep 20% of the base position for major force's upward wave.
💡 Teacher Panda's trading aphorism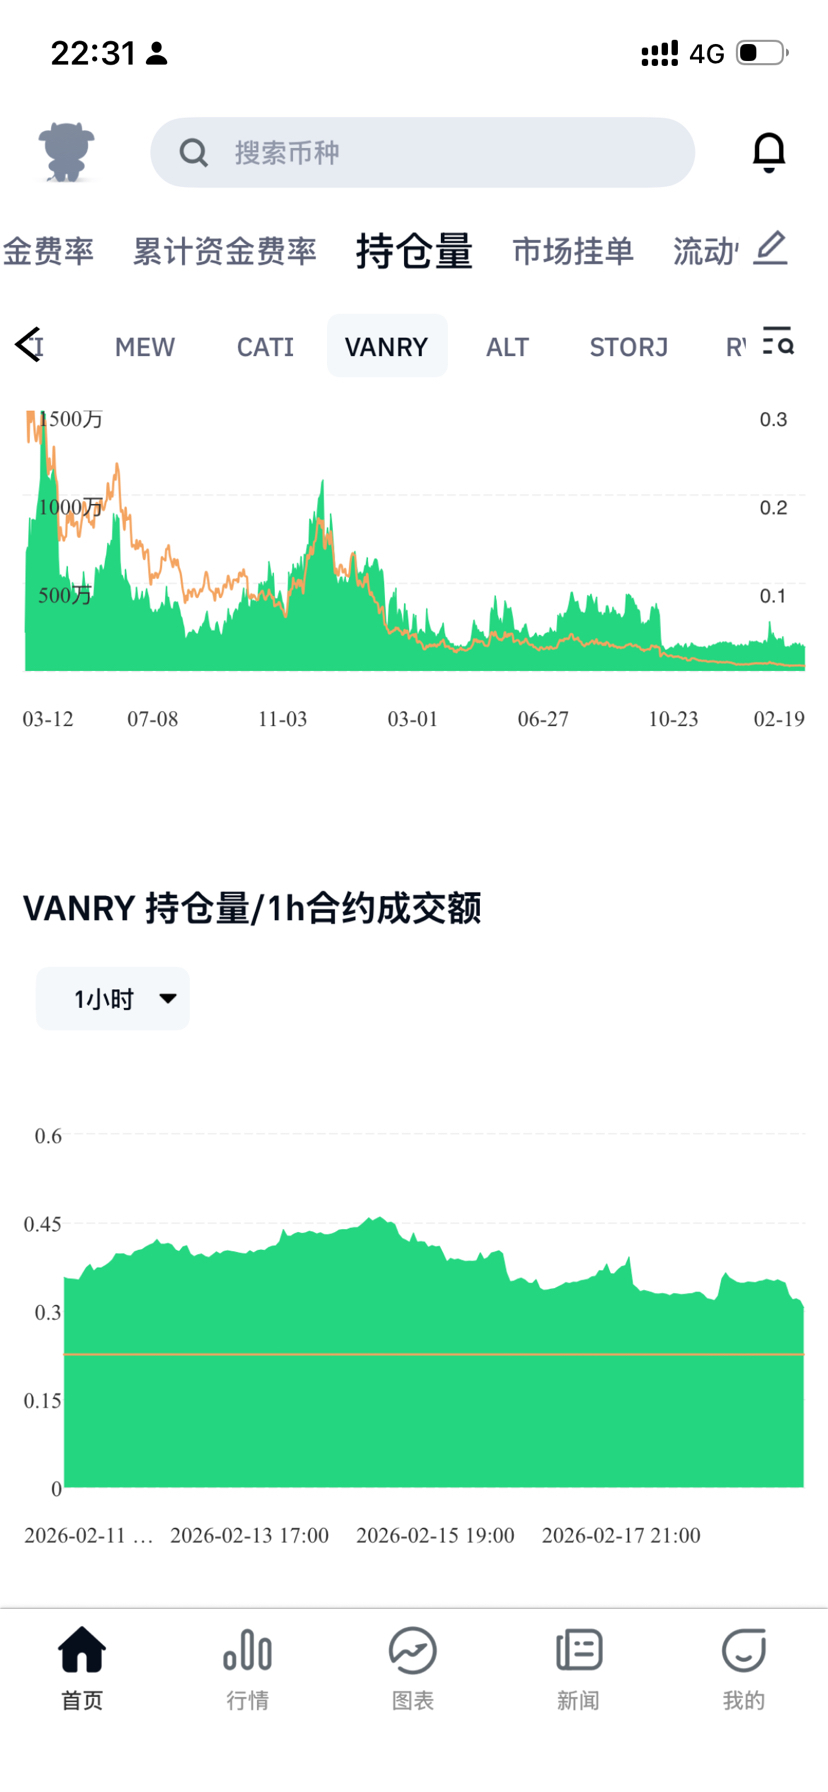
In trading, the hardest part is 'waiting' and 'unity of knowledge and action.' If VANRY does not spike down but flies up directly, let it go and never chase the high. The market is not short of opportunities; it lacks the patience to wait for the perfect risk-reward ratio.