---$TUT

🚀 TUT/USDT 4H Chart – Deep Technical Eye Analysis 🔥📊
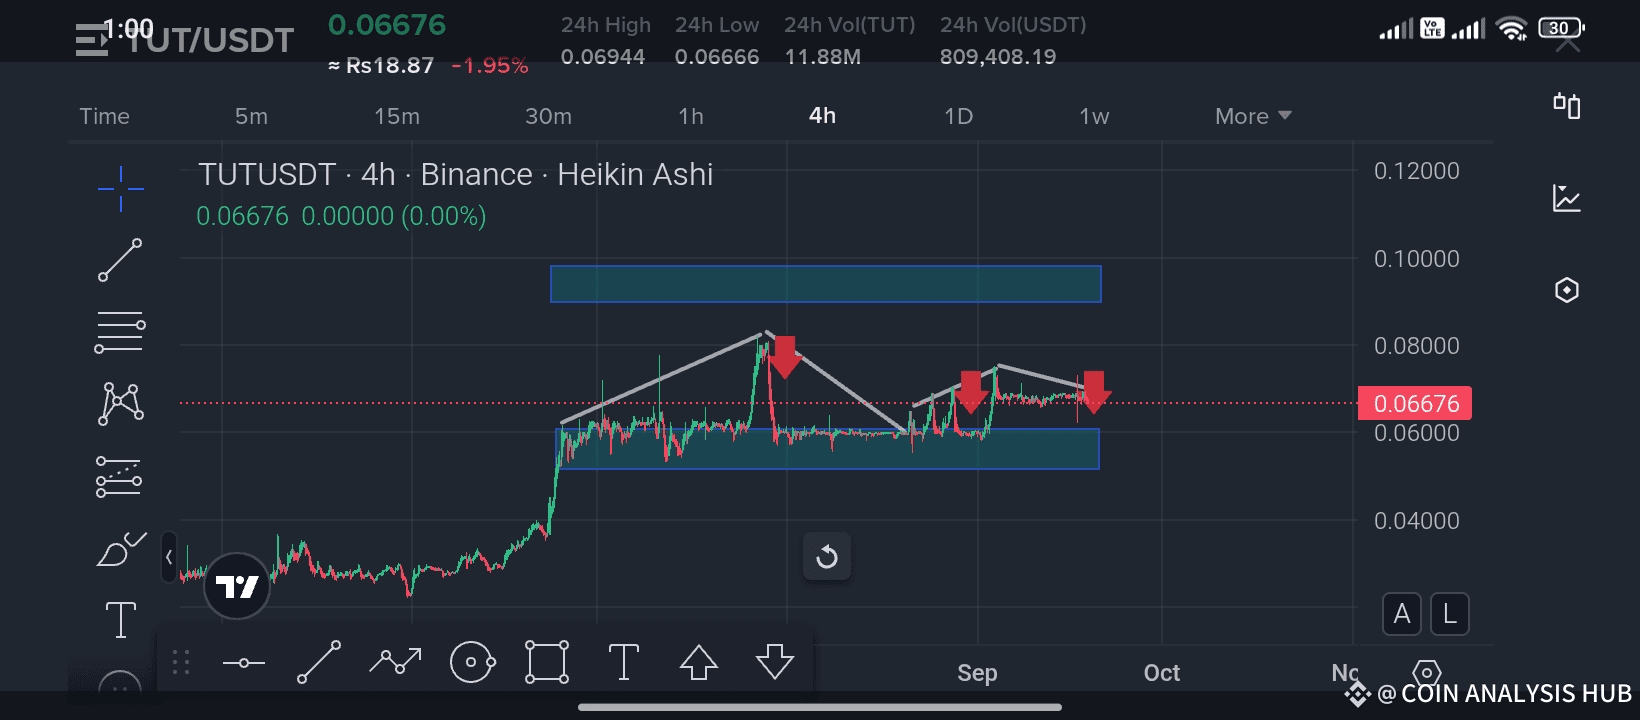
Traders, fasten your seatbelts! 🎯 Today, we’re diving into the TUT/USDT 4H chart (Binance – Heikin Ashi) to analyze the current market structure with a technical lens. Many traders are watching this zone carefully as the price action is giving us some crucial signals. Let’s break it down step by step. 👇
---
📌 Current Market Snapshot
Price: $0.06676
24h High: $0.06944
24h Low: $0.06666
Volume: 11.88M TUT
At the moment, the price is consolidating near the mid-level after facing rejection from upper resistance zones multiple times. The chart clearly highlights a range-bound structure where price has been bouncing between two blue rectangular zones:
🔹 Support Zone: Around $0.06000 – $0.06600
🔹 Resistance Zone: Around $0.09000 – $0.10000
---
📈 Pattern Observation – Traders’ Eye 👀
If you observe the red arrows on the chart, you’ll notice repeated lower highs forming after every push towards the resistance. This indicates seller dominance at higher levels. Each attempt to break higher is being rejected, which shows that supply is heavy in the upper range.
On the other hand, the support zone has been holding strong 💪. Buyers have stepped in every time the price dropped towards $0.06000 levels, preventing a deeper fall. This is a classic accumulation vs. distribution battle.
In simple words:
Bears 🐻 are active at the top.
Bulls 🐂 are defending at the bottom.
This tug-of-war is keeping the market in a sideways range.
---
⚡ Key Technical Insights
1️⃣ Trend Structure:
Overall, the coin is in a sideways consolidation phase after an earlier impulsive move. The market is taking a breather here.
2️⃣ Volume Analysis:
We are witnessing declining volume on each retest of the resistance zone. This shows that buyers are losing strength with every push upwards.
3️⃣ Support Confirmation:
The lower blue zone has been tested multiple times, and each time buyers defended it successfully. A break below this would be a strong bearish signal.
4️⃣ Heikin Ashi Candle Analysis:
Currently, the Heikin Ashi candles are showing smaller body candles with wicks, which represent indecision and potential reversal zones.
---
🎯 Possible Scenarios Ahead
Let’s map out what could happen next, so we can plan accordingly:
📌 Bullish Case:
If buyers manage to push above $0.08000 with strong volume, we could see a rally back towards the $0.10000+ resistance zone. 🚀 A confirmed breakout will attract momentum traders and could trigger a mini bull-run.
📌 Bearish Case:
If the $0.06600 – $0.06000 support zone breaks, the next target could be $0.05000 or even lower. Bears will dominate, and panic selling could come into play. ⚠️
📌 Neutral Case:
Price may continue bouncing between the two blue zones, keeping traders in suspense. Swing traders will benefit the most from this sideways structure.
---
💡 Trader’s Tip (Read Carefully!)
👉 Always wait for confirmation before entering trades in such range-bound structures.
👉 If you’re a scalper, you can take advantage of smaller moves between support and resistance.
👉 If you’re a swing trader, the best strategy is to buy near support and sell near resistance until the breakout happens.
👉 Never chase pumps 🚫 – always plan entries with patience and discipline.
📊 Pro Tip: Use volume spikes as confirmation. A breakout backed by strong volume is more reliable than one with weak volume.
---
🔑 Psychological Perspective 🧠
Markets are driven not just by charts, but also by trader psychology. Right now:
FOMO buyers are getting trapped near resistance.
Strong hands are accumulating near support.
Whales are likely playing both sides, creating liquidity.
The best way to stay safe is to trade smart, not emotional. Protect your capital and trade with a plan. 📝
---
🌟 Final Thoughts
At $0.06676, TUT/USDT is standing at a make-or-break point. The next few candles on the 4H chart will decide whether we break down below support or test the resistance once again. 📉📈
For now, the market is in a no-trend zone – perfect for patient traders but dangerous for impulsive ones. Remember, trading is not about predicting; it’s about reacting. Wait for the move, then ride the trend. ⚡
---
🔥 If you found this analysis helpful, don’t forget to LIKE 👍, SHARE 🔄, and FOLLOW ➕ my channel for more real-time market insights and technical breakdowns. Your support helps us reach more traders and grow this community. Let’s learn and earn together! 💰📊
💬 Drop your thoughts in the comments – Do you think TUT/USDT will break down or pump again? 🚀👇
#Crypto #TUTUSDT #Binance #TechnicalAnalysis #TradersLife
Best of luck 🤞 🍀 🤞