hello my fellow traders ...
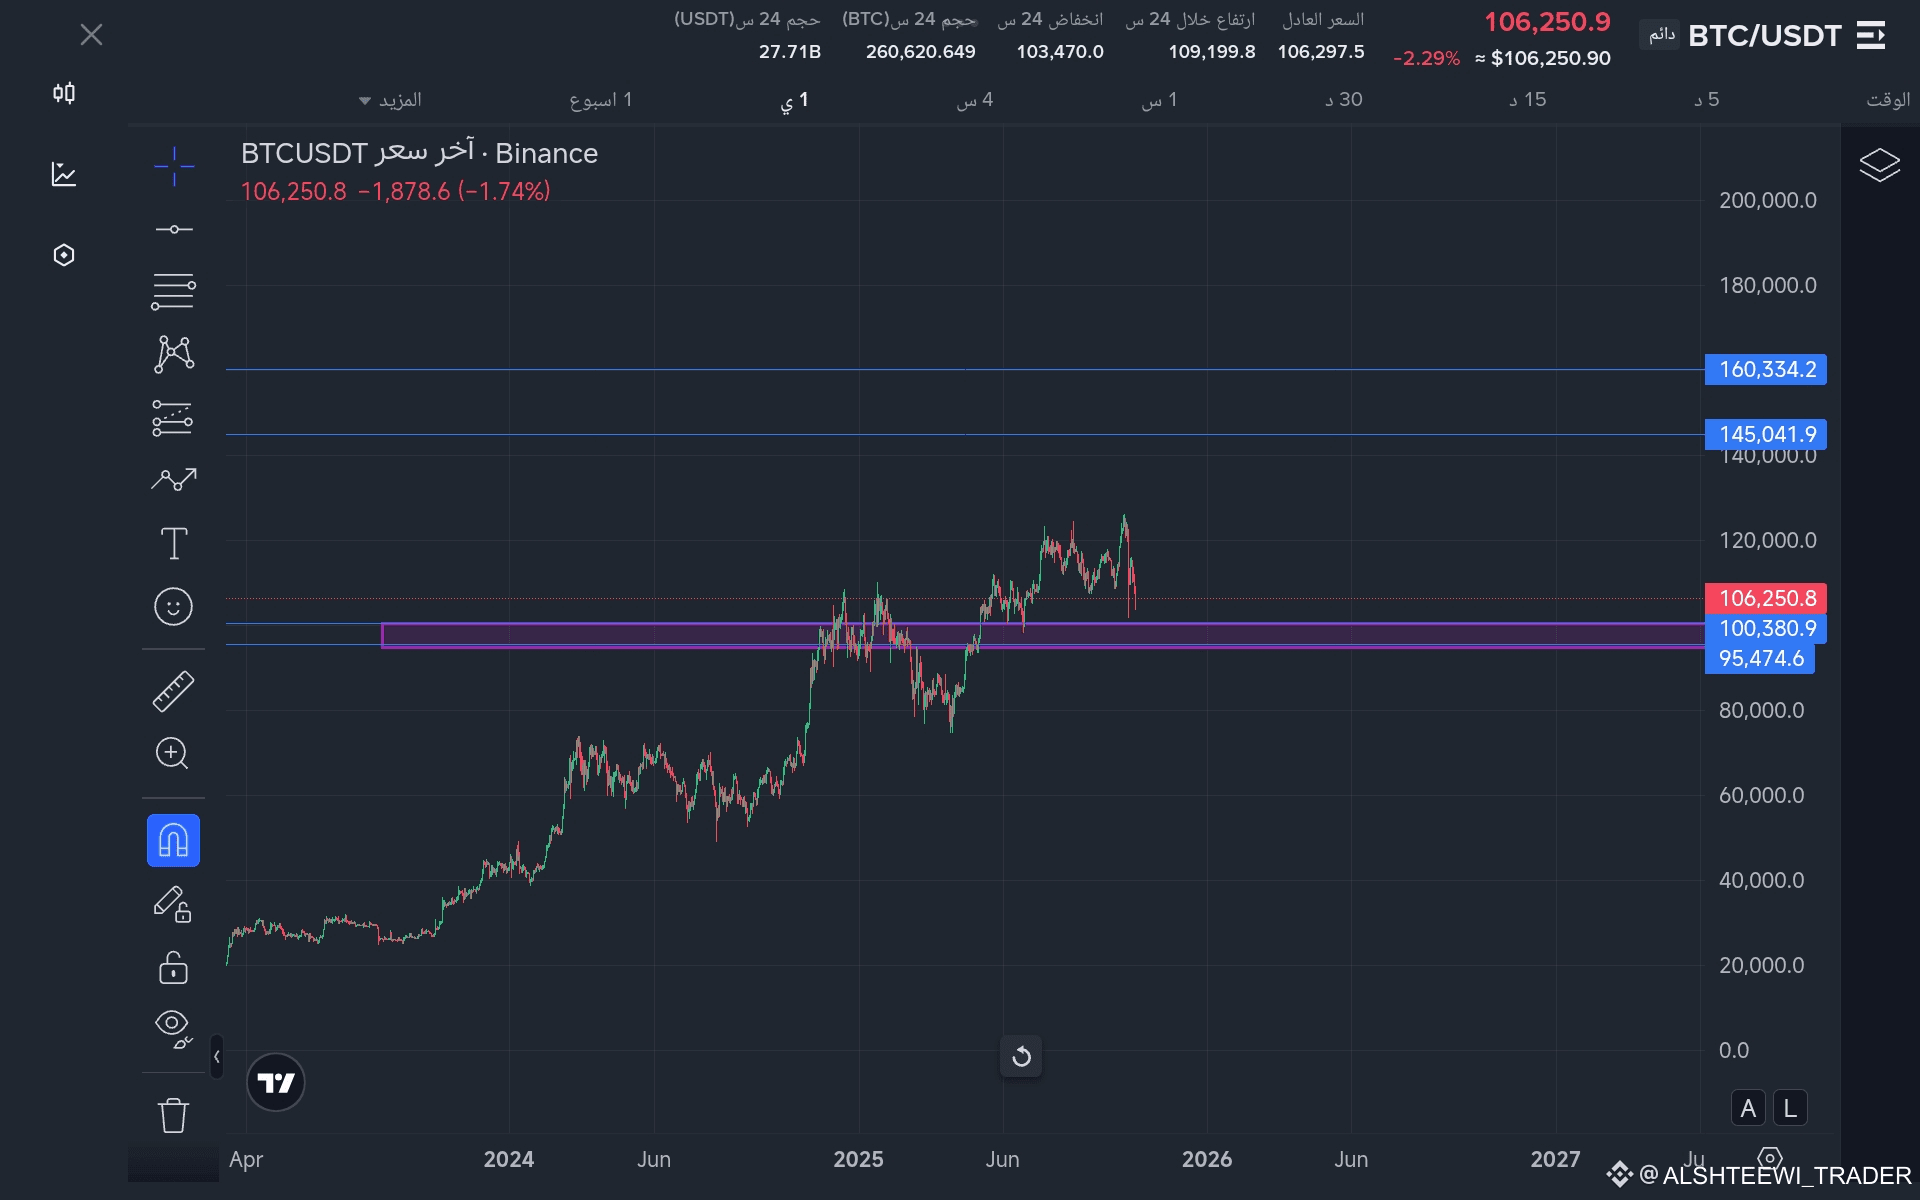
the BTCUSDT show's a big trend in the daily frame and we look in the last liquidity support line prices between (95000/100000) .
when the price enter those levels support 95/100 get ready to enter a long buy wait for. your setup and confirmation in the frame 1H chart
positive in the end of this year you will see new levels between (140000/16000).
Ai Analyze Chart :
In the BTC/USDT chart you've provided, a liquidity sweep could be observed in the recent price movement. Here are some specific details regarding this:
1. **Area of Interest**: The price has recently approached the key support level around 100,380.9, where buying activity may have been concentrated. If there was a sudden influx of buying orders, it could indicate a liquidity sweep.
2. **Price Reactions**: After hitting this support level, monitor how the price reacts. A robust bounce back above this level suggests that buyers are stepping in, confirming interest at this price point.
3. **Volume Observation**: Pay close attention to volume spikes. A high trading volume during this price drop followed by a bounce could indicate the execution of large orders, characteristic of a liquidity sweep.
4. **Trading Opportunities**: If a liquidity sweep occurs near this support level with a quick recovery, it might indicate a good entry point for a long position, especially if it aligns with an upward trend after the drop.
5. **Risk Management**: Consider placing a stop-loss slightly below the support level to manage the risk of a false breakout. This way, if the price continues to drop below your stop-loss, you minimize potential losses.
Analyzing these elements can help determine if a liquidity sweep is happening and how to effectively trade around it. Would you like further assistance with specific setups or examples?
