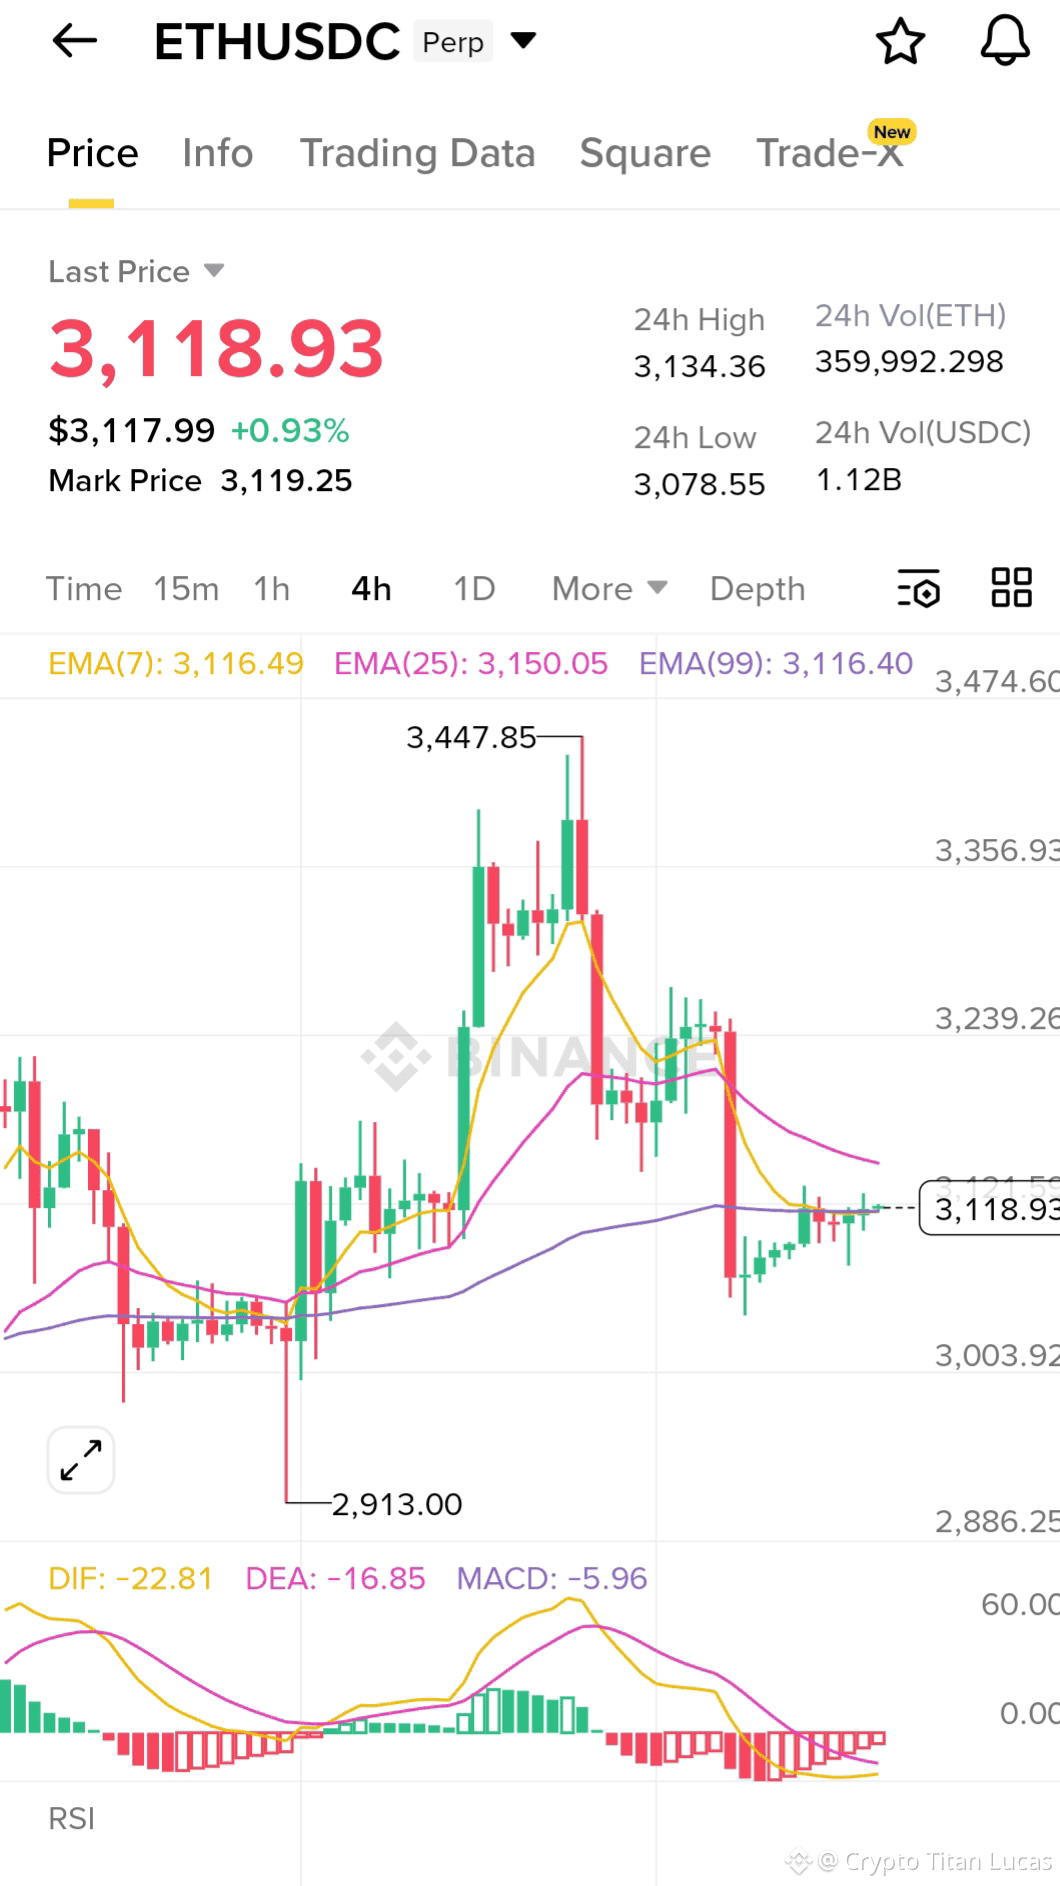
1. Price Below Key EMAs: Current price (3,118.93) is below EMA(25) at 3,150.05, indicating short-term bearish momentum.
2. MACD Bearish:
· DIF (-22.81) is below DEA (-16.85)
· MACD histogram (-5.96) is negative, confirming bearish momentum.
3. Lower Highs Structure: Price has formed a series of lower highs from 3,474.60 → 3,447.85 → 3,356.95 → 3,239.26.
4. Failed Recovery: Recent bounce failed to break above 3,239.26, maintaining the downtrend.
5. RSI Weakness: RSI is in the lower half (likely below 50), indicating bearish momentum.
6. Support Break: Price has broken below the 3,239.26 support level and is hovering near 3,118.95.
7. High Volatility with Downward Pressure: 24-hour range (3,078.55 - 3,134.36) shows selling pressure near highs and inability to hold gains.
Bearish Outlook:
· A break below 3,118.95 could lead to a test of 3,003.92 and then 2,913.00.
· Resistance is strong near 3,239.26 and 3,356.95.
· The EMA(7) at 3,116.49 is acting as dynamic resistance.
Recommendation:
Consider short positions if price breaks below 3,118.95 with targets at 3,003.92 and 2,913.00. A stop loss above 3,239.26 would be prudent.


#BinanceBlockchainWeek #ETH #BNB_Market_Update