Asset: XRP/USD (Ripple cryptocurrency)
Current Price (Last): 1.8664
Preferred Scenario: Bullish rebound targeting 1.9470.
Pivot Point: 1.8317 (key level that determines the intraday bias – hold above for bullish continuation).
Alternative Scenario: If price breaks below 1.8317, expect bearish acceleration towards 1.7881, then 1.7621.
Technical Indicators:
RSI is below its neutrality area at 50, signaling weak upward momentum.
MACD is negative but positioned above its signal line (potential bullish divergence).
Overall configuration: Mixed signals.
Price is trading below both the 20-period moving average (at 1.8724) and the 50-period moving average (at 1.9011), confirming short-term bearish pressure.
Key Supports and Resistances:
Resistances: 1.9990 ** (strong), 1.9730 , 1.9470 * (strong target), 1.9210
Supports: 1.8489, 1.8317 ** (pivot, strong), 1.7881 , 1.7621 * (strong)
Comment: The setup leans toward a potential rebound if the pivot at 1.8317 holds, possibly driven by oversold conditions. However, the price remaining below key moving averages and RSI <50 keeps downside risks alive. Monitor for a clear break of the pivot for direction.
(Note: As of December 18, 2025, live XRP/USD prices are trading around $1.90–$1.92 across major exchanges, slightly higher than the "last" level in this analysis snapshot.)
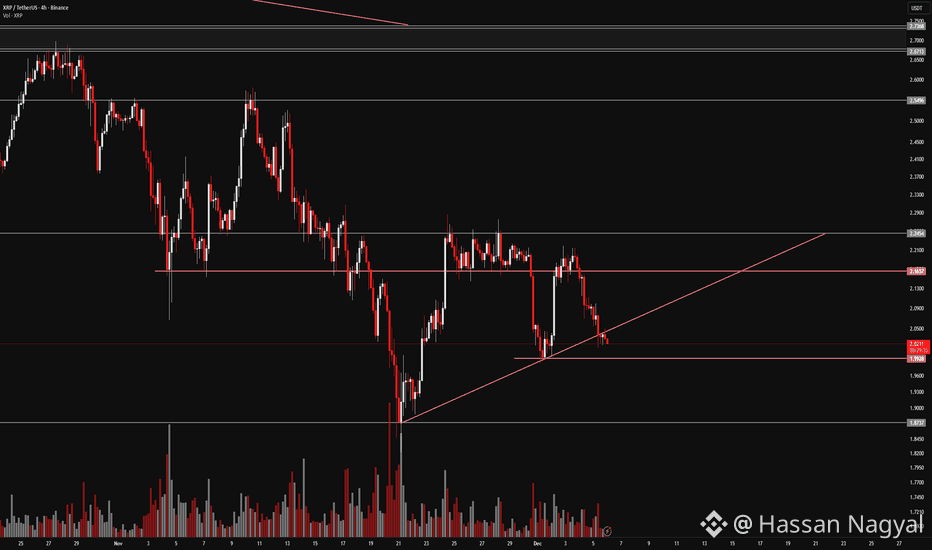
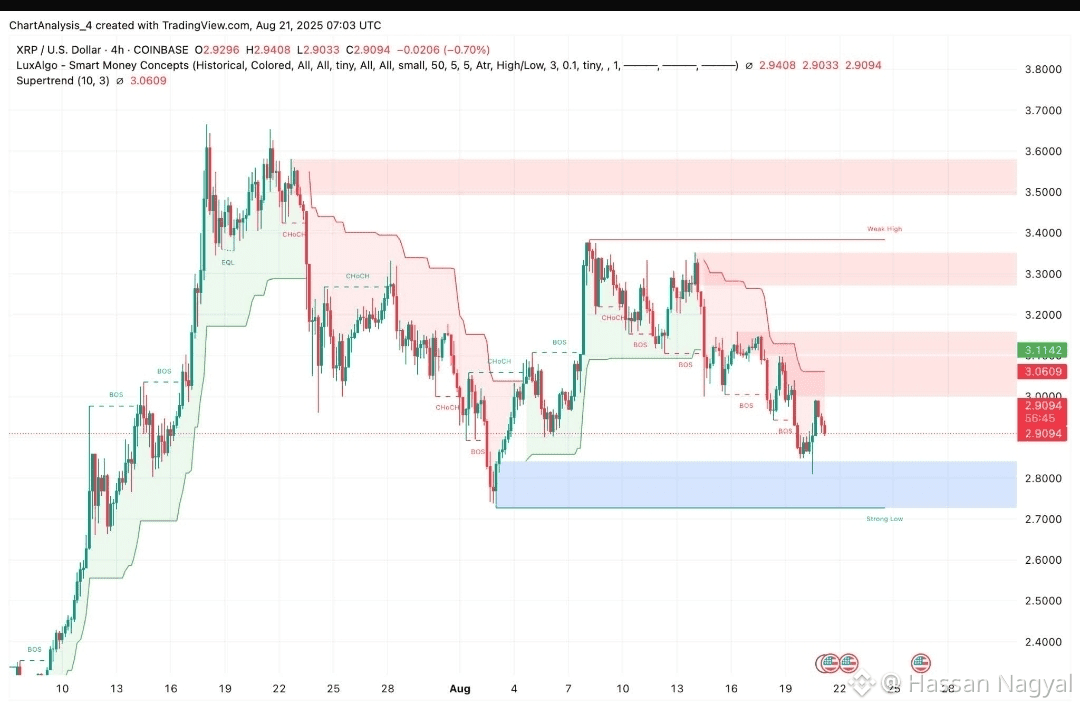
Here are some relevant XRP/USD technical charts for visual reference