XRP has posted a modest **2.3% daily rebound**, but the broader trend remains fragile. The token is still **down nearly 14% over the past month** and **8.5% lower week-over-week**, signaling continued weakness beneath the surface.
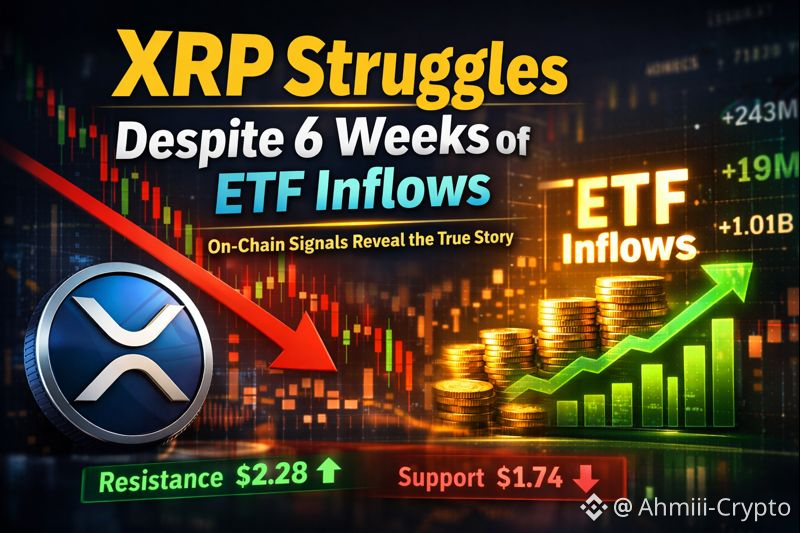
What makes this underperformance stand out is the backdrop: **six consecutive weeks of spot XRP ETF inflows**. While that headline sounds bullish, a deeper look at ETF momentum and on-chain data explains why XRP’s price has failed to ignite.
ETF Inflows Continue — But the Fuel Is Running Low
Spot XRP ETFs have now logged **six straight weeks of net inflows**, pushing cumulative totals beyond **$1.01 billion** since mid-November.
Early demand was strong:
Nov 14:** $243.05M inflows
Nov 21:** $179.60M
Nov 28:** $243.95M
Dec 5:** $230.74M
However, momentum has clearly faded since then.
Dec 11:** Inflows dropped sharply to $93.57M
Dec 16:** Just $19.44M was added
While inflows remain positive, the **rate of accumulation is slowing fast**. This deceleration helps explain why XRP has failed to extend gains, even as ETFs continue to attract capital. Simply put, ETF demand is no longer strong enough to drive price expansion on its own.
On-Chain Data Shows Conflicting Signals From Long-Term Holders
On-chain metrics paint a divided picture among XRP holders.
One red flag comes from the **percentage of XRP supply last active over one year ago**, which has climbed from **48.75% on December 2 to 51.00%**, the highest level in roughly a month. When dormant coins begin moving, it often signals **potential sell-side pressure** entering the market.
At the same time, another long-term holder metric tells a slightly more constructive story. The **Hodler Net Position Change** for wallets holding XRP longer than 155 days shows **selling pressure is easing**:
* Net outflows peaked at **216.86M XRP on Dec 11**
* Fell to **154.57M XRP by Dec 16**
* That’s a **29% reduction in net selling**
This split behavior suggests that while some older supply is becoming active (bearish), others are pulling back from aggressive selling. That balance has helped XRP avoid a sharp breakdown so far. However, unless this metric flips into **net accumulation**, any upside moves may be vulnerable to sell-offs.
Key XRP Price Levels That Could Define the Next Move
XRP’s price action reflects this uncertainty. The token is currently trading within a **falling wedge**, stuck between weakening momentum and fragile support.
Bullish Break Scenario
A **daily close above $2.28** would break the wedge
This could unlock a **~19% upside**, shifting momentum back in favor of buyers
Bearish Risk Zone
A breakdown below **$1.74** (0.618 Fibonacci level) exposes XRP to **$1.59**
Further downside could extend toward **$1.41** if broader market weakness persists
Bottom Line
ETF inflows alone are no longer enough to support XRP’s price. With **cooling ETF demand** and **mixed on-chain signals**, XRP remains caught between stabilization and renewed downside risk.
Until long-term holders begin accumulating again and ETF inflows regain momentum, **XRP price action is likely to stay range-bound — with downside risks still in play**.
