This indicator simply measures the time between each block in order to determine whether blocks are being produced faster or slower than the expected 10 minutes.
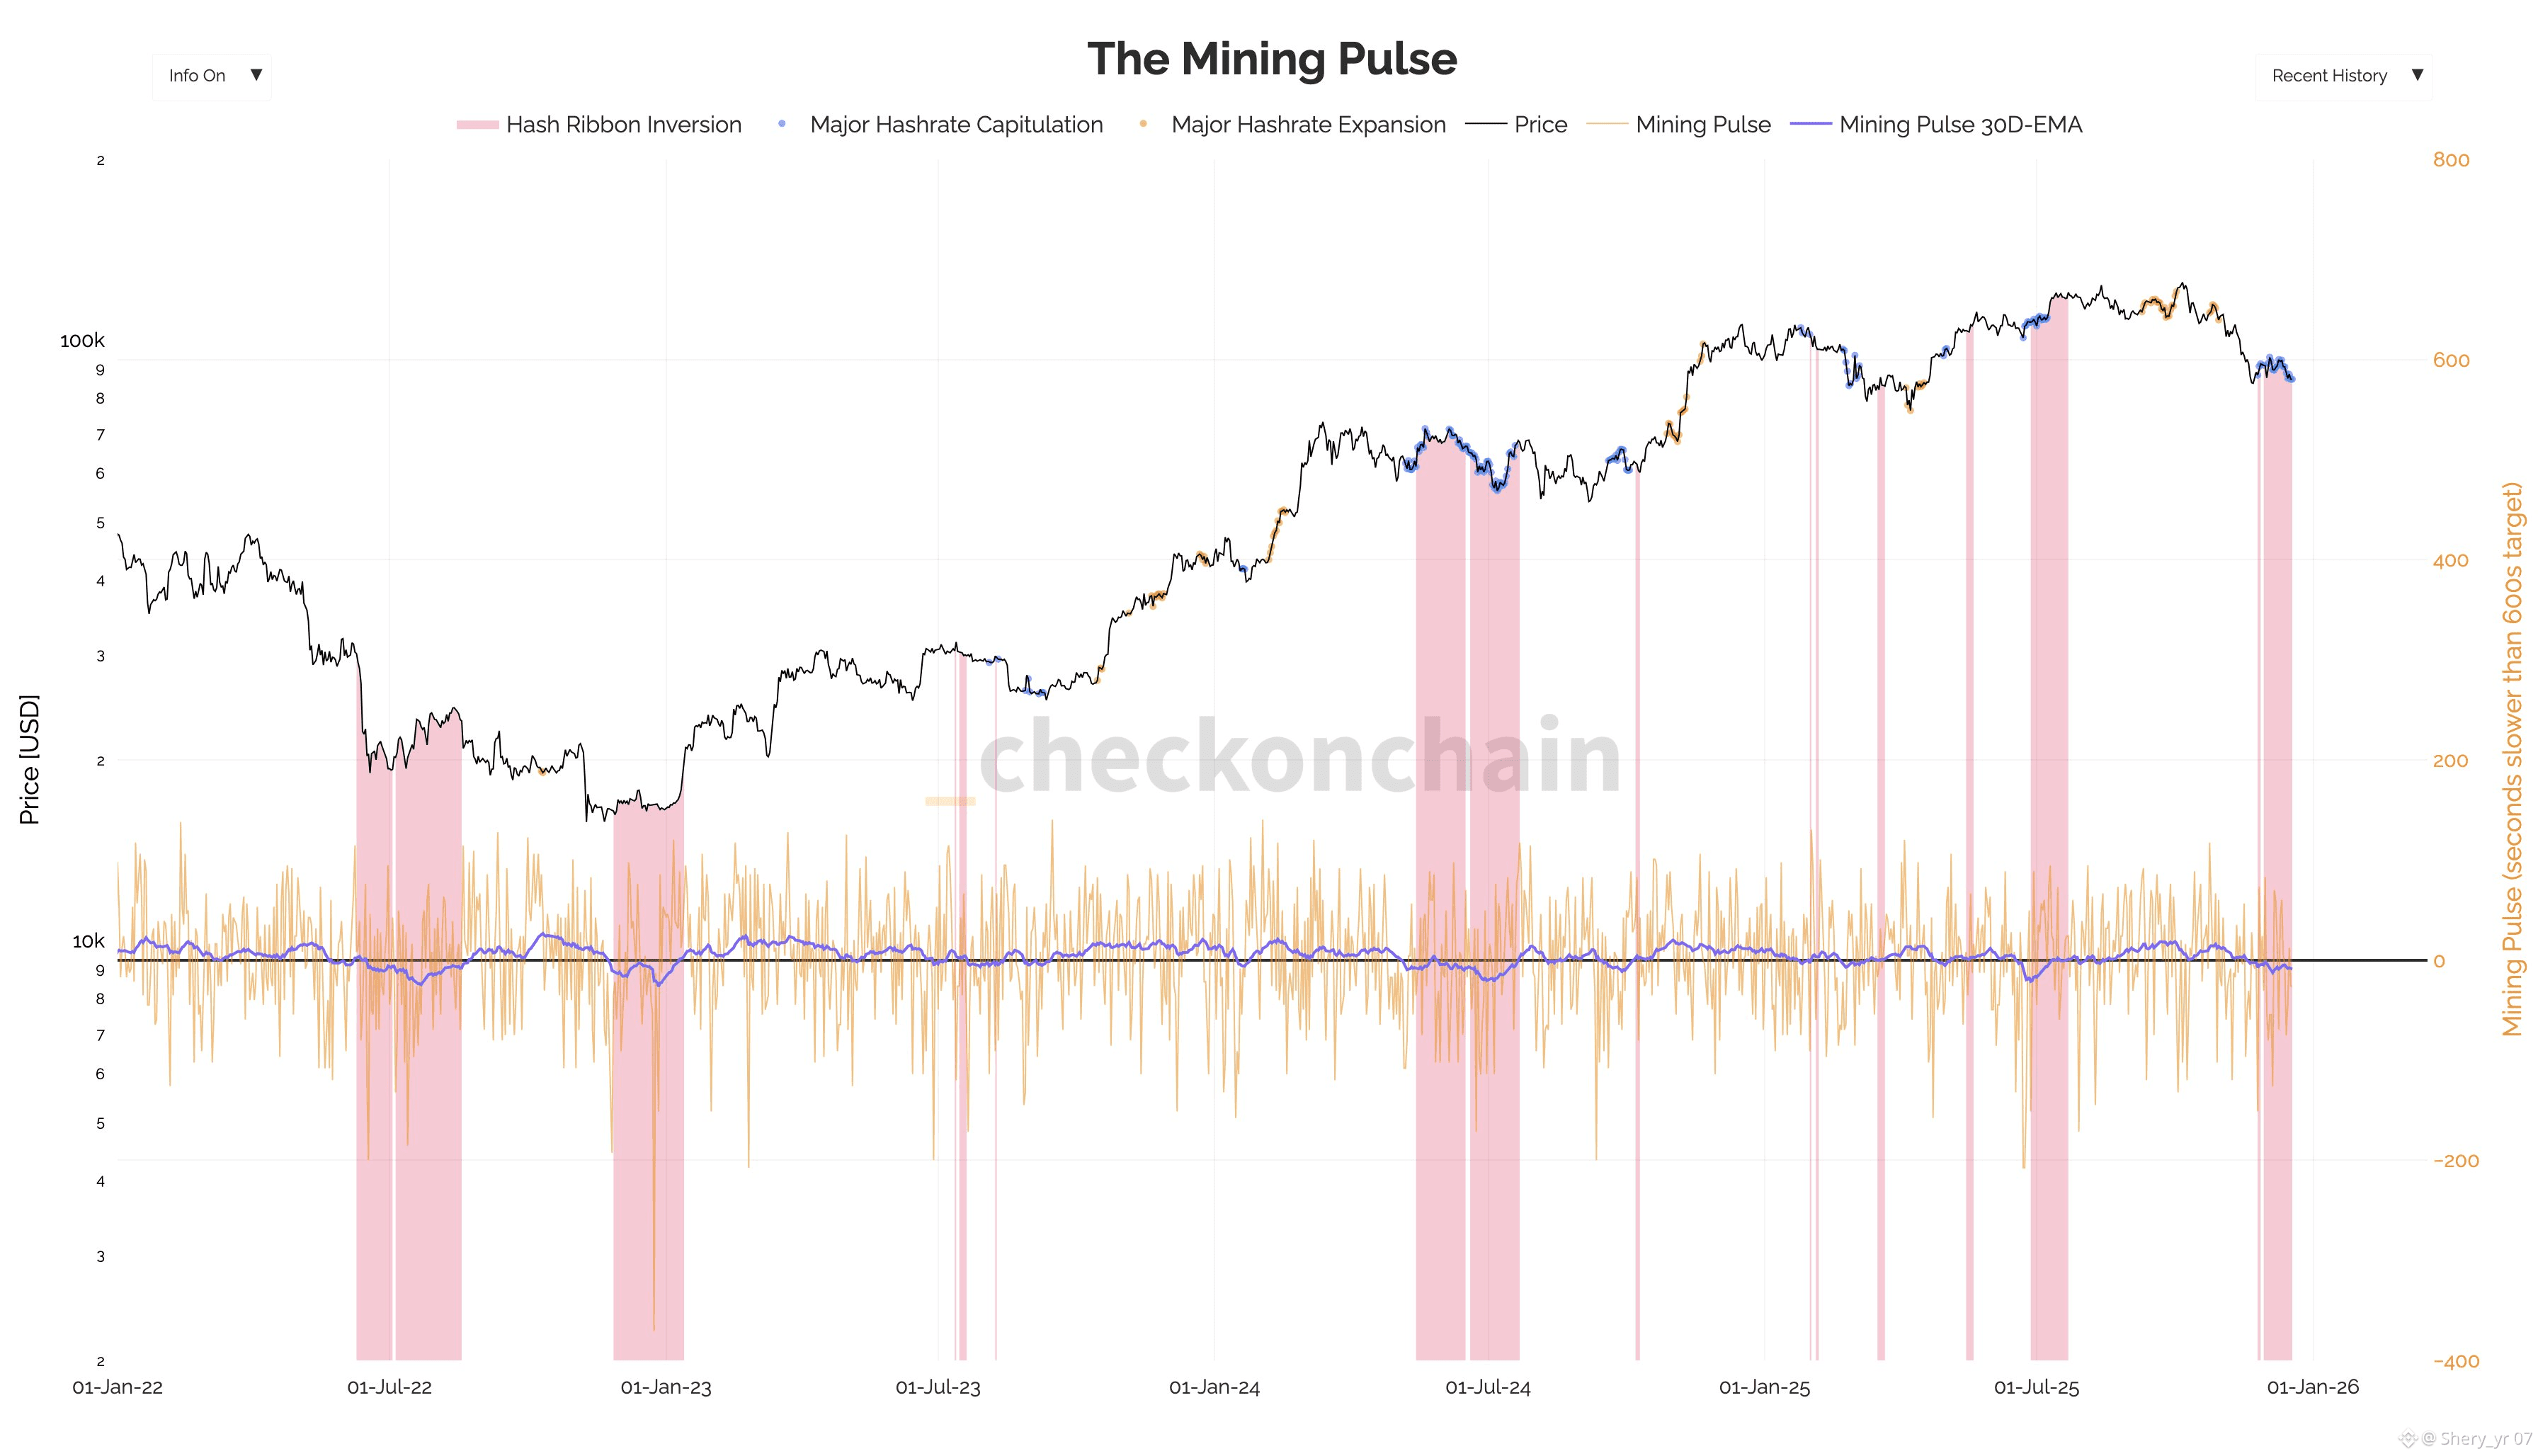
To reduce noise and provide a more cyclical rather than instantaneous view, the signal is calculated using a monthly average.
It is based on this mechanism that mining difficulty adjusts every 2016 blocks.
💥 When the time between blocks increases, as is the case today, it reflects a period of miner stress.
Difficulty is too high, blocks become harder to mine, and this forces weaker mining pools and miners to shut down their machines and sell BTC to cover costs.
📉 In the short term, this selling pressure tends to weigh on the market until difficulty readjusts downward.
Historically, this process has often been part of bottom formation.
Once conditions normalize and difficulty adjusts, mining becomes easier again, restoring profitability.
Miners can then resume operations, earn block rewards to cover their costs, and reduce the need to sell BTC.
This is why monitoring hashrate contractions, shown in blue 🔵 on the chart, can provide valuable insight.
Miners remain one of the most significant sources of selling pressure on Bitcoin, especially at a time when overall market liquidity is relatively low.
👉 For now, the Mining Pulse remains in negative territory.
However, when it starts to recover, it should be interpreted as a positive signal.
