Bitcoin ($BTC ) continues to navigate a turbulent landscape this week, showing signs of stabilization after a sharp mid-month collapse. As of December 19, the BTC/USD pair is oscillating between critical support levels and heavy resistance, leaving traders to wonder: Is this the bottom of the dip, or a pause before another leg down?
Technical Analysis: The Battle for $93,000:
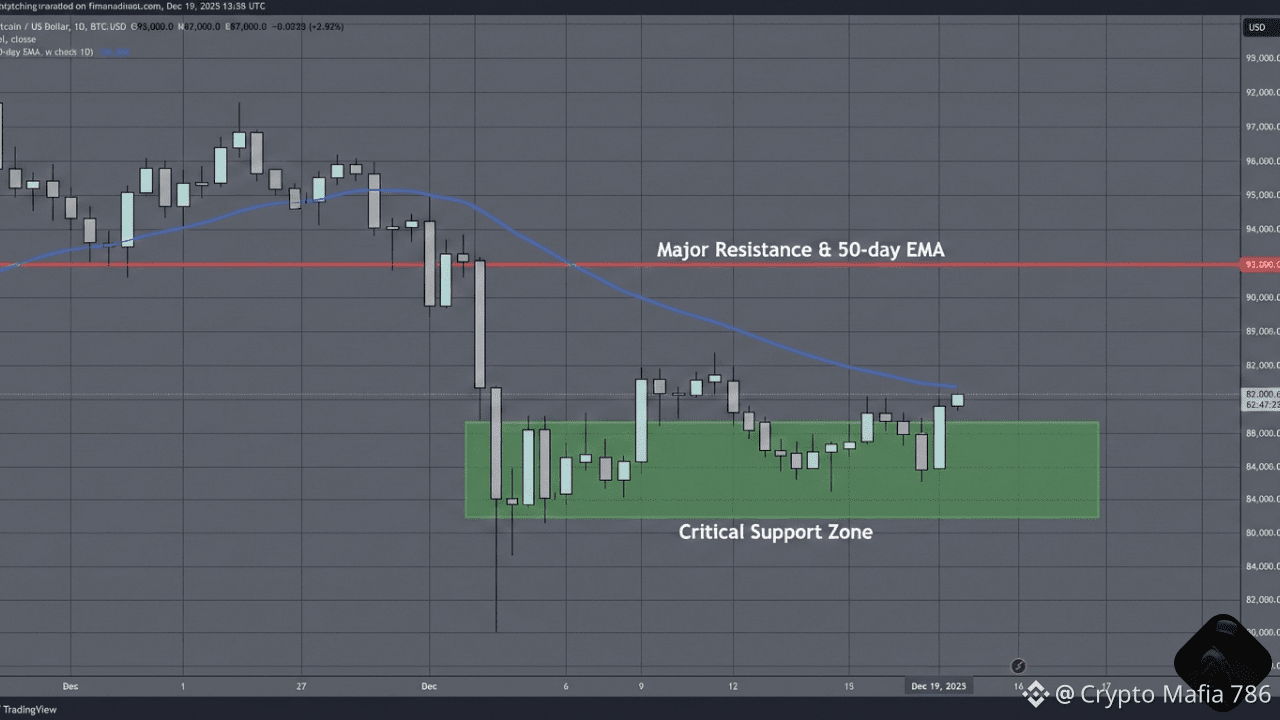
The technical picture for Bitcoin$BTC remains one of cautious consolidation. Following a significant retreat from higher levels earlier in the month, the market is currently searching for a "floor."
Key Resistance Levels
The $93,000 level has emerged as a formidable barrier. Not only is this a psychological hurdle, but the 50-day Exponential Moving Average (EMA) is currently hovering just above this mark, adding a layer of technical "noise" that bulls must overcome to regain control. Until Bitcoin can decisively close above $93,000 on a daily timeframe, the upside remains capped.

Key Support Levels:
On the downside, the zone between $80,000 and $84,000 is the primary line of defense.
$84,000: Acting as immediate short-term support where buyers are "nibbling."
$80,000: The "must-hold" level. A breach below $80k could trigger a rapid descent toward $75,000 or even the $65,000 liquidity pocket.
Latest Analysis: What’s Driving the Market Today?
While the DailyForex report from December 18 highlighted a "two-speed market," the situation has evolved over the last 24 hours due to significant macro shifts:
1. The "Extreme Fear" Paradox
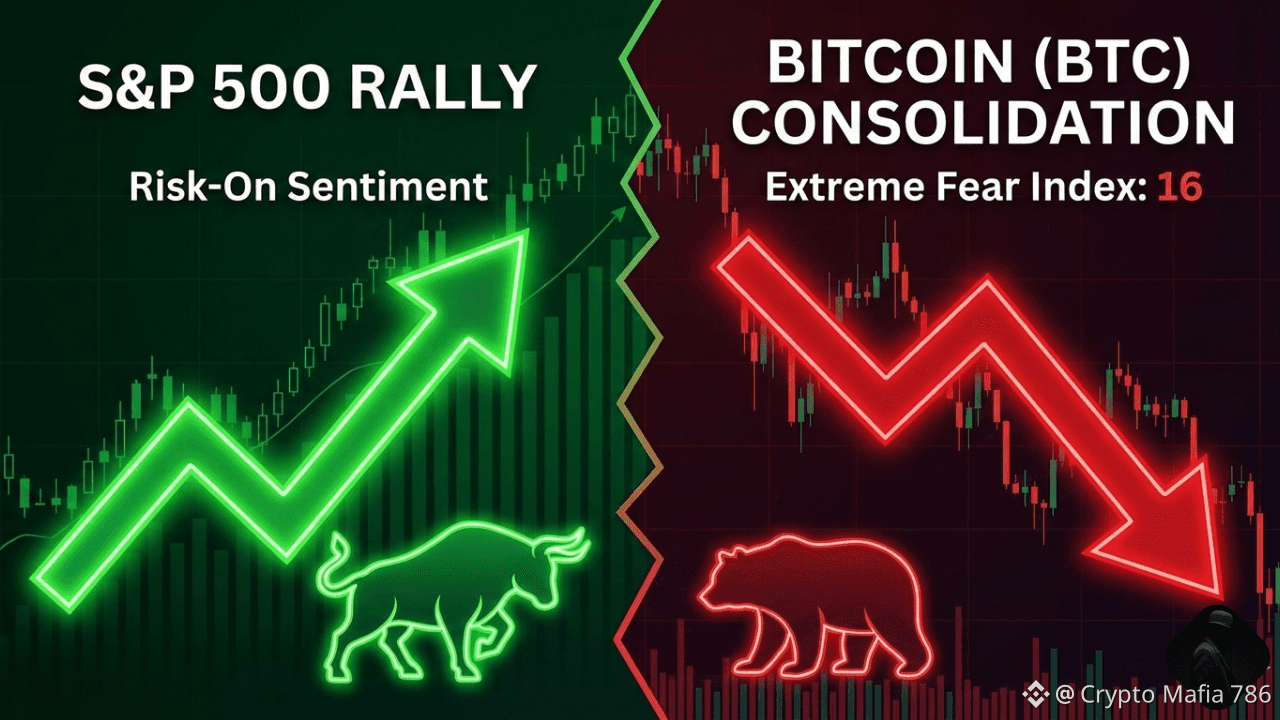
The Crypto Fear & Greed Index has plummeted to 16 (Extreme Fear). Historically, such low readings have often signaled generational buying opportunities, but the current divergence is striking. While the S&P 500 and Nasdaq are rallying on soft U.S. inflation data, Bitcoin has struggled to keep pace, suggesting a "risk-off" mood specifically within the digital asset space.
2. The Bank of Japan (BoJ) Factor
Global markets were rattled on December 19 by the Bank of Japan’s decision to hike interest rates to a 30-year high. This has strengthened the Yen and triggered a partial unwinding of the "carry trade," which often sucks liquidity out of high-volatility assets like Bitcoin. This explains why BTC is struggling to break out even as traditional tech stocks soar.
3. Regulatory Winds
On a positive note, sentiment is being propped up by news that the U.S. Senate is scheduling a markup for the Digital Asset Market Clarity Act in January 2026. This regulatory progress, backed by the "Crypto President" administration, provides a structural tailwind that keeps long-term institutional targets of $150,000 on the table for 2026.
Trading Strategy: How to Play the BTC/USD Range:
Given the current "two-speed" market, your approach should depend on your time horizon:

For Long-Term Investors: The current consolidation between $84k and $87k represents a potential accumulation zone. With the Fear & Greed Index at 16, "nibbling" here allows for positioning before a potential 2026 recovery.
For Short-Term Traders: Wait for momentum. The market is currently "noisy." A break above the 50-day EMA ($93k+) would be the green light to go long, while a break below $80k is a clear signal to move to the sidelines or look for shorting opportunities toward $75k.
Final Verdict:
$BTC is in a healthy "sideways" phase after a collapse. As long as the $80,000 level holds, the path of least resistance will eventually turn back toward the upside as the market absorbs recent macro shocks.
Disclaimer:
Trading cryptocurrencies involves significant risk. This analysis is for informational purposes only and does not constitute financial advice.
#Bitcoin❗ #BTC☀️ #BTCVSGOLD #BinanceSquareTalks #TrendingTopic