$BTC After months of on-chain analysis, historical cycle comparison, and realized price modeling, one level consistently stands out:
$56,000.
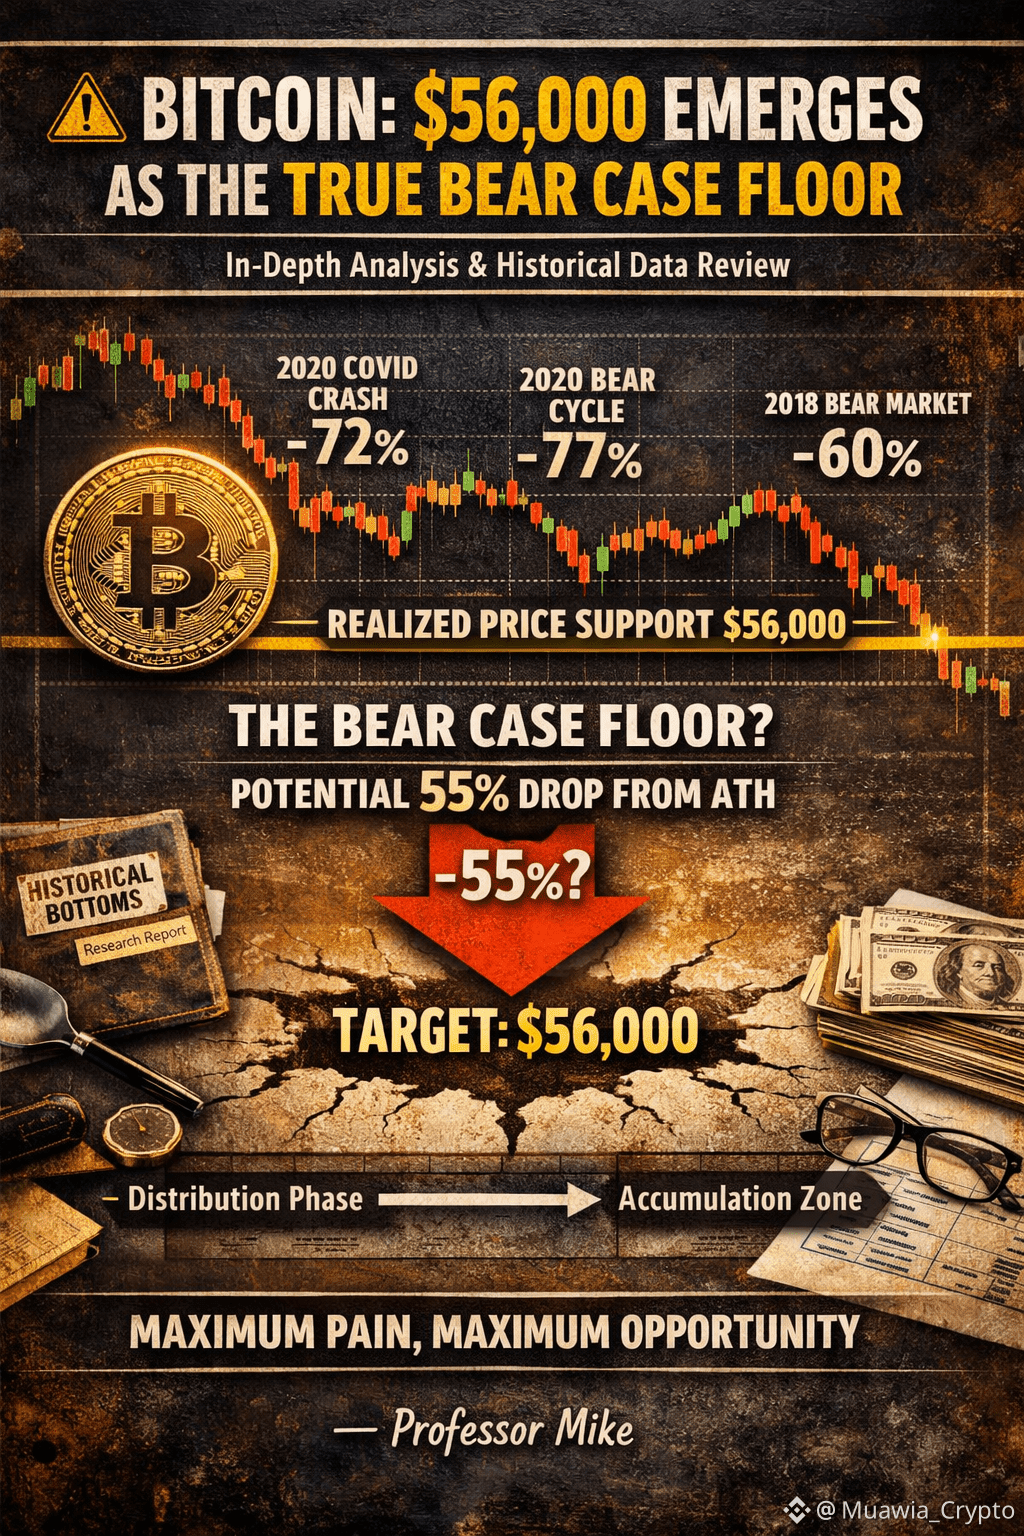
Bitcoin has now tested its Realized Price three separate times across major macro-driven bear cycles — and every single instance marked the ultimate cycle bottom, not just a temporary bounce.
Let’s put this into historical context:
• 2018 Bear Market → Price capitulated ~60% from the cycle high before stabilizing at Realized Price
• COVID Liquidity Crash (2020) → A violent ~72% drawdown ended precisely at Realized Price
• 2022 Macro Tightening Cycle → The deepest reset yet, with a ~77% peak-to-trough decline, again bottoming at Realized Price
This pattern is not coincidence — it reflects maximum investor pain, where short-term holders capitulate and long-term holders absorb supply.
Where we stand now
Bitcoin’s current Realized Price sits near $56K.
If history rhymes — not repeats — this places the maximum bear-case downside at roughly 55% from the recent all-time high.
That does not mean $56K is guaranteed. It means below this level, Bitcoin has historically transitioned from distribution to long-term accumulation.
📌 Key takeaway:
$56K isn’t a prediction — it’s a risk boundary.
Above it, volatility dominates.
At it, cycles historically end.
Smart money doesn’t guess bottoms.
It defines where the odds structurally shift.
— Professor Mike