

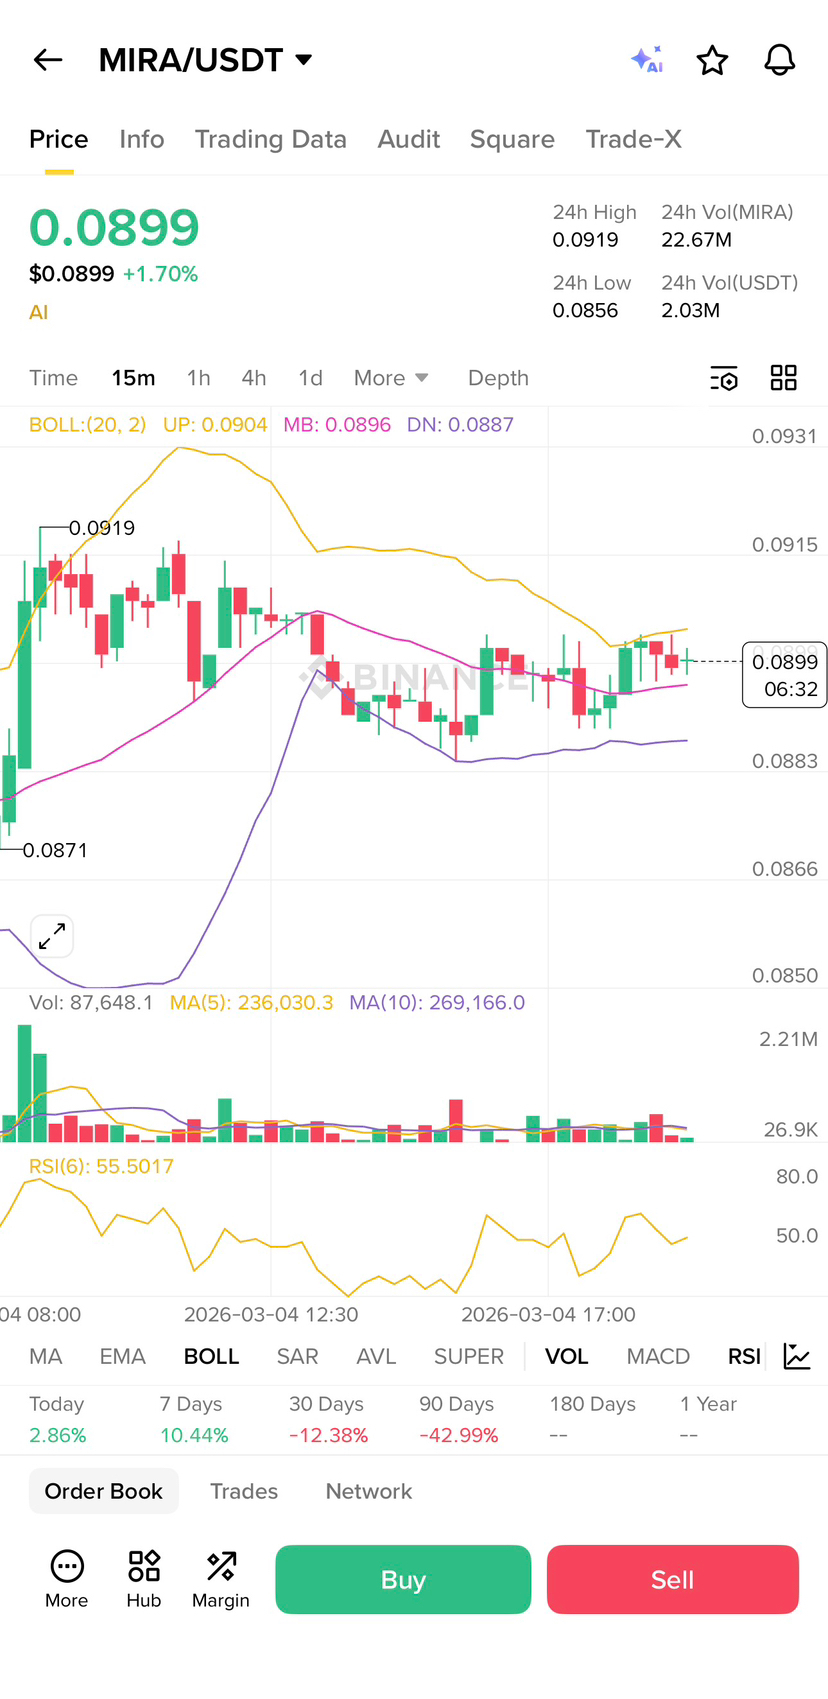
Today I was checking $MIRA chart and honestly something very interesting is forming. Price now trading around $0.0899 with small green move +1.70%, but what is more important is how the Bollinger Bands (20,2) behaving on this 15m timeframe.
First let us look careful.
Upper Band showing around 0.0904
Middle Band around 0.0896
Lower Band around 0.0887
Now see this clearly price is sitting almost on the middle band and slightly pushing up. This is very important sign. In Bollinger theory, when price stay above middle band, many times market preparing for upward continuation.
What I See In This Structure
Before price was touching lower band near 0.0883 area. That was like market testing support. Example simple:
Imagine rubber band when you stretch it down too much, it bounce back. Same thing here. Price touched near lower band, then buyers came and pushing it back to middle band.
Now candles are small but stable. Not heavy red panic. Volume also not dying. This is showing accumulation zone maybe happening.
Also notice upper band starting to curve slightly sideways instead of falling hard. When bands stop expanding down and start flattening, volatility squeeze can come. And usually squeeze break direction of last momentum. Last momentum from 0.0871 low to 0.0919 high was bullish. So probability leaning upside.
Real Example From Chart
Earlier today price moved from 0.0871 to 0.0919. That was strong expansion phase. After that correction happened but it did NOT break previous low. That means structure still higher low.
Higher low + holding middle Bollinger band = bullish bias.
If price break above 0.0904 (upper band) with volume increase, then we can see quick push to retest 0.0919 high again. And if that break clean, next psychological level maybe around 0.0930 area.
RSI Also Supporting
RSI now around 55. That is not overbought. It means still room to climb. If RSI was 75 I will worry. But now it is healthy zone. Market not exhausted.
Why This Looks Like Up Move Coming?
1. Price holding above lower band
2. Middle band acting as support
3. RSI not overbought
4. No heavy sell volume
5. Previous structure higher low
This is like someone pushing ball underwater but slowly releasing it. When pressure build enough pop!
Of course nothing 100% in market. If price close strong candle below 0.0887 lower band then scenario change. But right now, momentum slowly building.
Sometimes best move come when market look boring. And this 15m chart look quiet but strong inside.
MIRA maybe preparing next leg up. Smart traders watching this squeeze carefully.
Let us see how next candles behave