Can ETH bulls take off? 2011 is the key support point!
1. 4-hour level trend analysis (general direction)
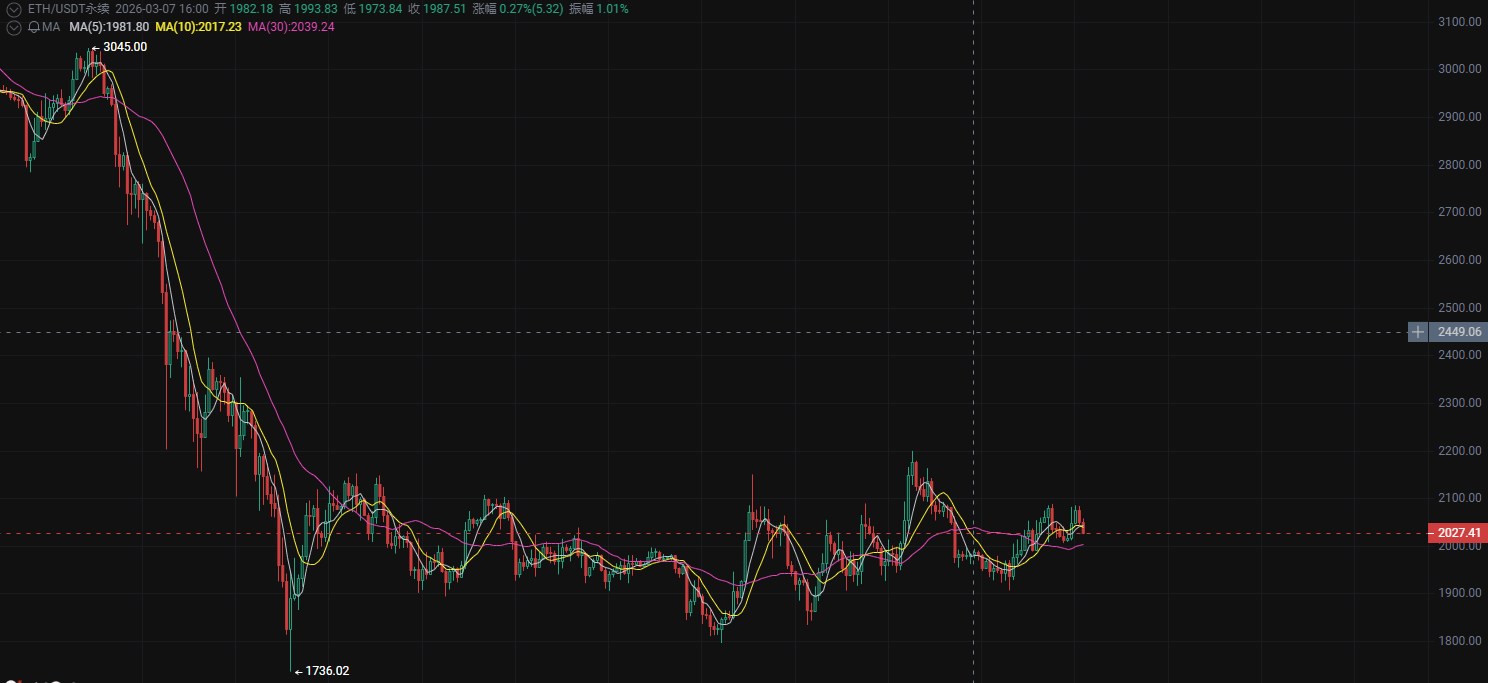
From the 4-hour chart structure, ETH is currently in a consolidation phase after a strong pullback, hovering near the key support area.
Key price area
This structure shows:
Bulls still hold the advantage and are consolidating near key support zones, preparing for an upward breakout.
If ETH breaks through 2050 with increased volume, it will trigger a new round of upward wave.
2. 1-hour level structure (short-term entry signal)
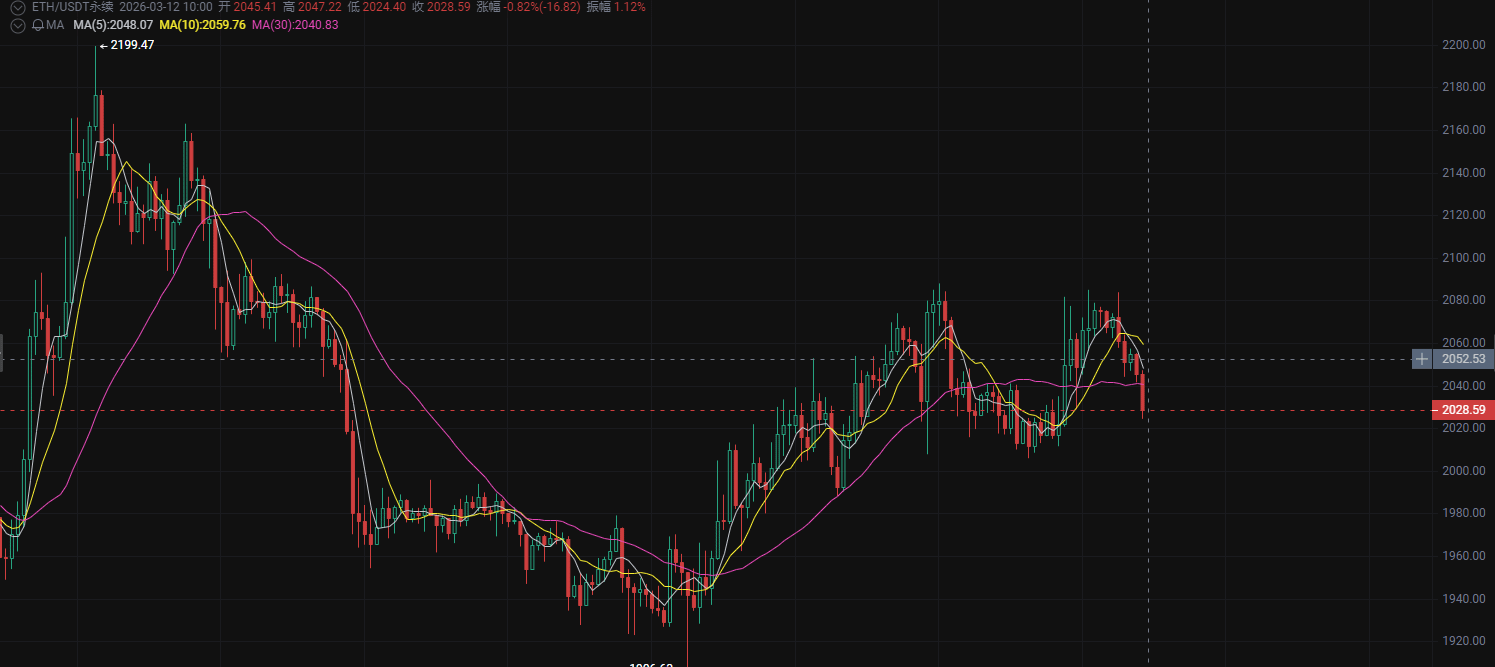
On the 1-hour chart, ETH is currently forming a slight consolidation with signs of triangular convergence.
Market characteristics:
Price volatility is tightening.
Lower highs forming
Higher lows forming
This pattern often signals:
A directional breakout is imminent.
3. Core long strategy
Entry position: 2024
First take profit: 2054
Second take profit: 2081
Stop loss level: 1991