
The USDT trading volume data and BTC-specific demand data are measuring different assets entirely — and right now they are telling opposite stories. Understanding why is the most important structural read for the current market.
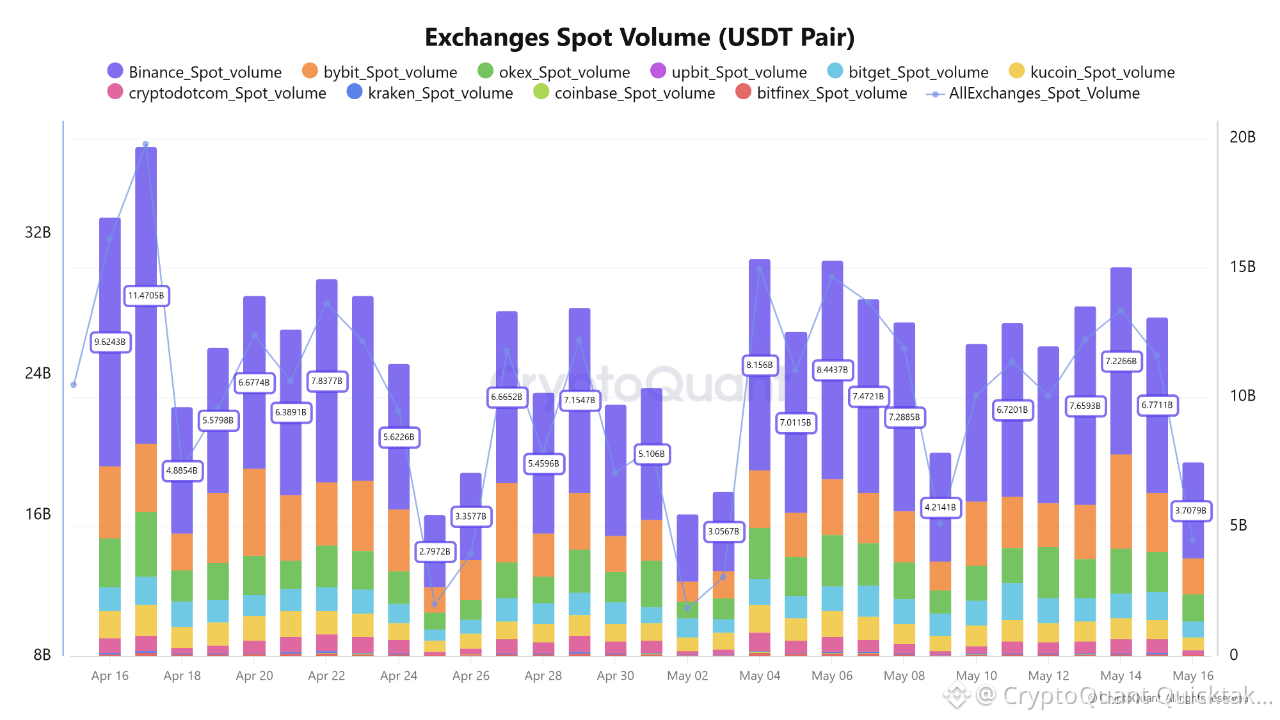
Binance's spot trading share has risen to 26.9% in May 2026, matching its October and November 2024 levels. Total all-crypto USDT spot volume across exchanges is averaging $22.5B per day. On the surface this looks like a market re-engaging. The problem is that USDT market share covers every crypto pair — BTC, ETH, SOL, altcoins, memecoins — and BTC-specific on-chain demand tells a different story entirely.
In October 2024, when Binance spot share was also at 26.5%, BTC apparent demand was running at +97K BTC. In November 2024's breakout, it was +190K BTC. In May 2026, BTC apparent demand is −28K BTC — negative for the 79th consecutive day. The volume on exchanges is real. The BTC accumulation behind it is not.
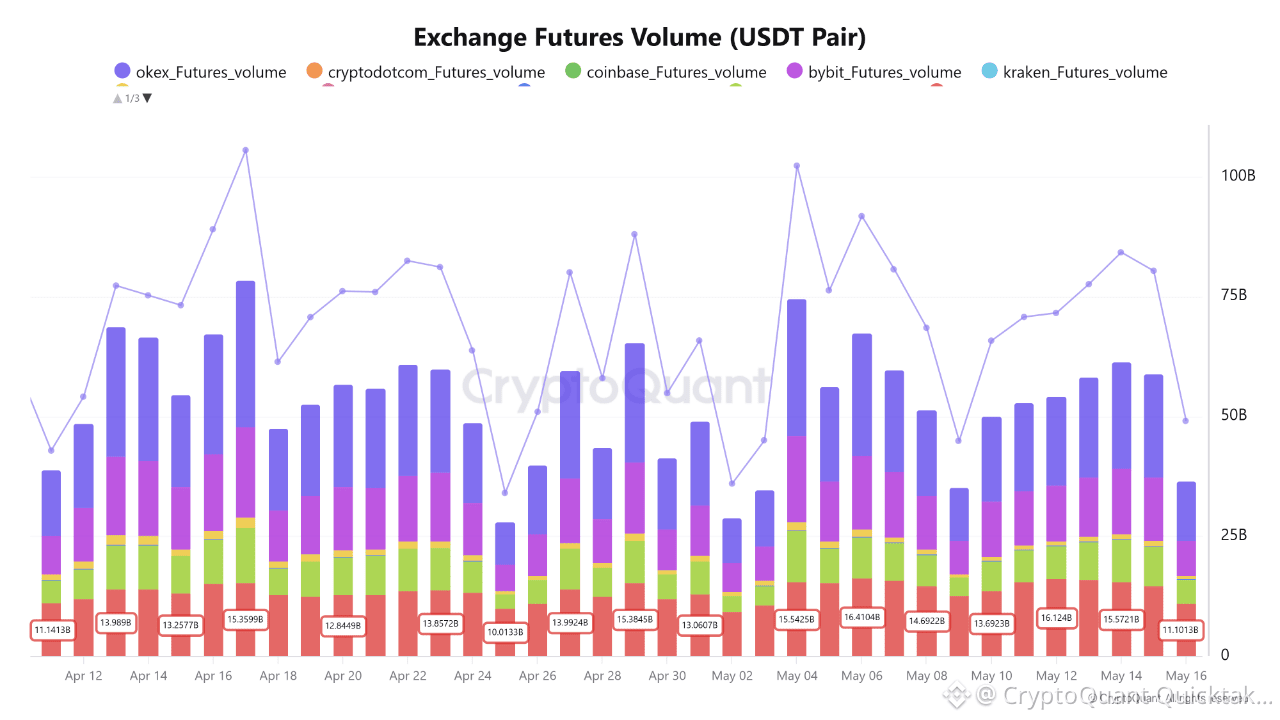
The data classifies the current setup clearly. Every month since April 2025 where all-crypto USDT volume was elevated while BTC apparent demand stayed negative falls into the same category: alt-driven activity. April 2025 saw $40B in daily all-crypto volume with BTC demand at −203K BTC. October 2025's $66B peak with BTC at −6K. The pattern is consistent — exchange volume rises during alt rotation and speculative repositioning periods regardless of what BTC holders are actually doing.
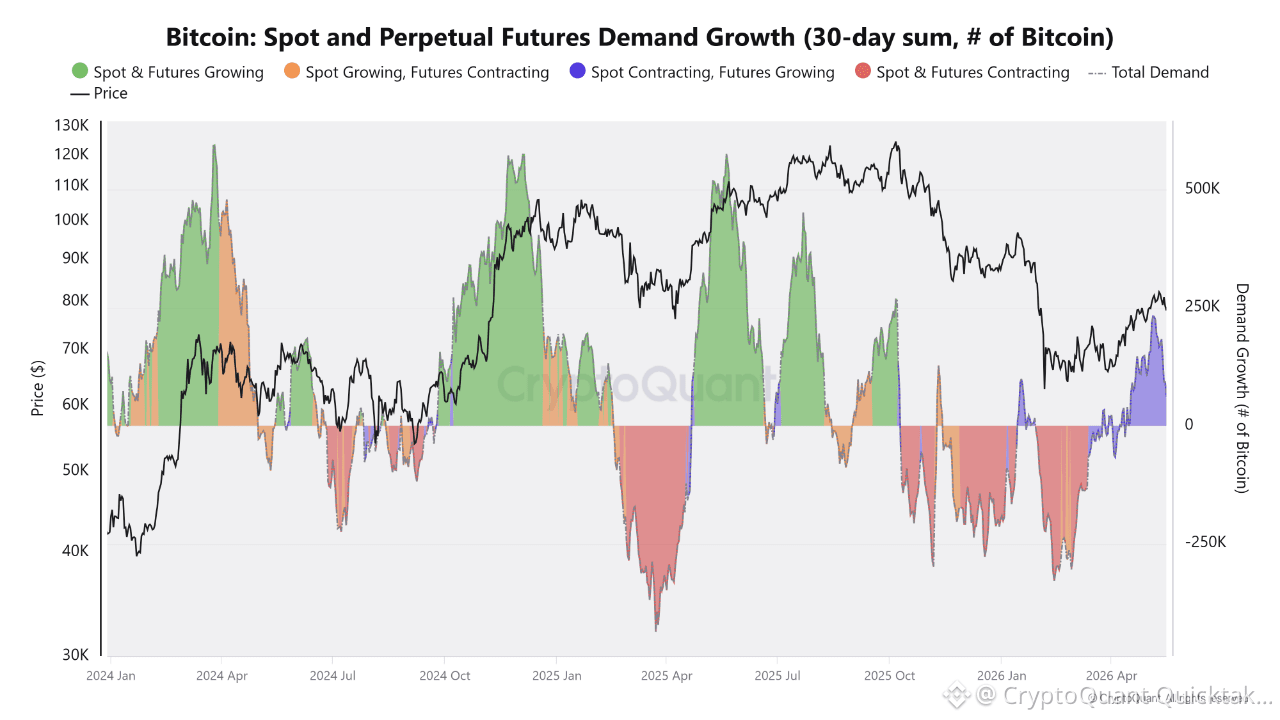
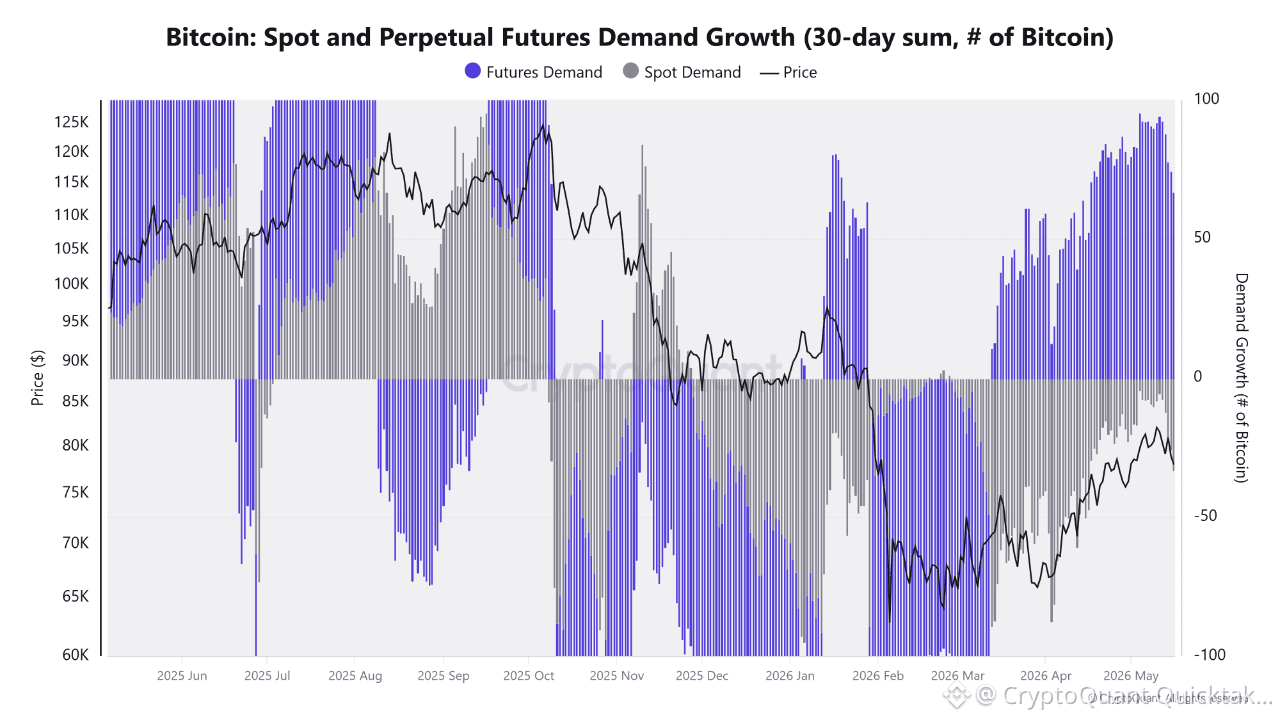
What is holding BTC price in the $79–82K range is futures-side demand, currently running at +193K BTC on a 30-day basis. That is a derivatives-driven bid, not spot accumulation. Futures demand was also strongly positive in May 2025 at +318K BTC — but that month it was accompanied by +99K BTC of spot demand. The current structure has one engine, not two.
Written by Crazzyblockk