
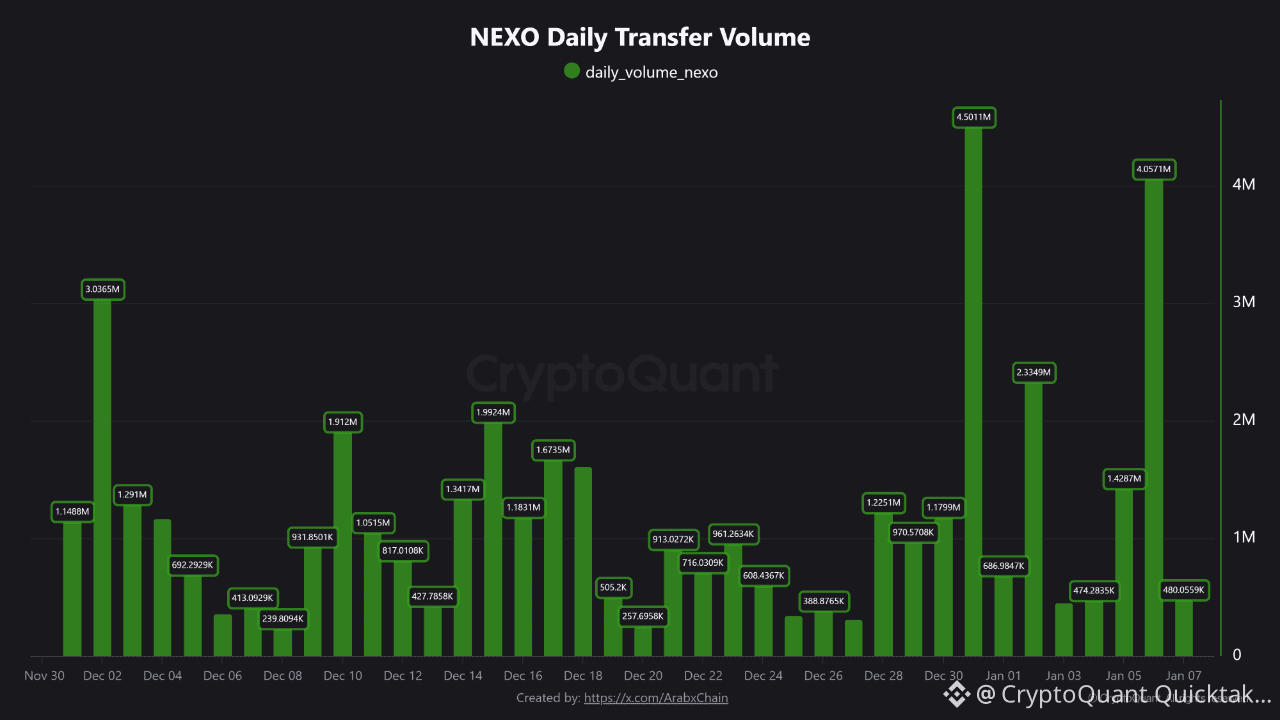
The NEXO Daily Volume chart shows the evolution of daily NEXO transaction volume on the Ethereum network from the beginning of December to early January 2026, revealing clear patterns in user activity and changes in demand for the token during this period.
At the beginning of December, daily trading volumes were relatively limited, with most values ranging between 400,000 and 1 million NEXO, reflecting a period of relative calm in network activity. However, this phase was short-lived, as sudden surges occurred on certain days, with daily volume exceeding 3 million NEXO. This suggests the presence of large transactions, possibly related to institutional portfolios or internal platform activity.
As December progressed, a more consistent pattern emerged, with recurring peaks between 1.3 and 2 million NEXO. This reflects a gradual increase in the token’s use for both transactional purposes and liquidity management. Such behavior often indicates rising confidence or anticipation of larger market movements.
Towards the end of December and the beginning of January, the most significant shift on the chart becomes apparent, as daily trading volume recorded a notable jump, exceeding 4.5 million NEXO in a single day the highest level observed during the period under review. This surge is typically interpreted as evidence of a major event, such as fund reallocation, heightened whale activity, or market anticipation of an upcoming price movement.
Written by Arab Chain