
⚠ Bitcoin Liquidity Is Rotating Again ⚠
Bitcoin’s Inter-Exchange Flow Pulse (IFP) has recently flipped back into bullish territory as the indicator crosses above its 90-day moving average. Historically, this signal has marked important transitions in market structure, particularly after prolonged periods of suppressed liquidity rotation between exchanges.
The IFP measures the intensity of BTC transfers between centralized exchanges, capturing how liquidity is redistributed across trading venues by market makers, arbitrage desks, and large institutional participants. When this activity accelerates, it often reflects a renewed willingness of professional capital to reposition inventory in anticipation of increased trading opportunities.
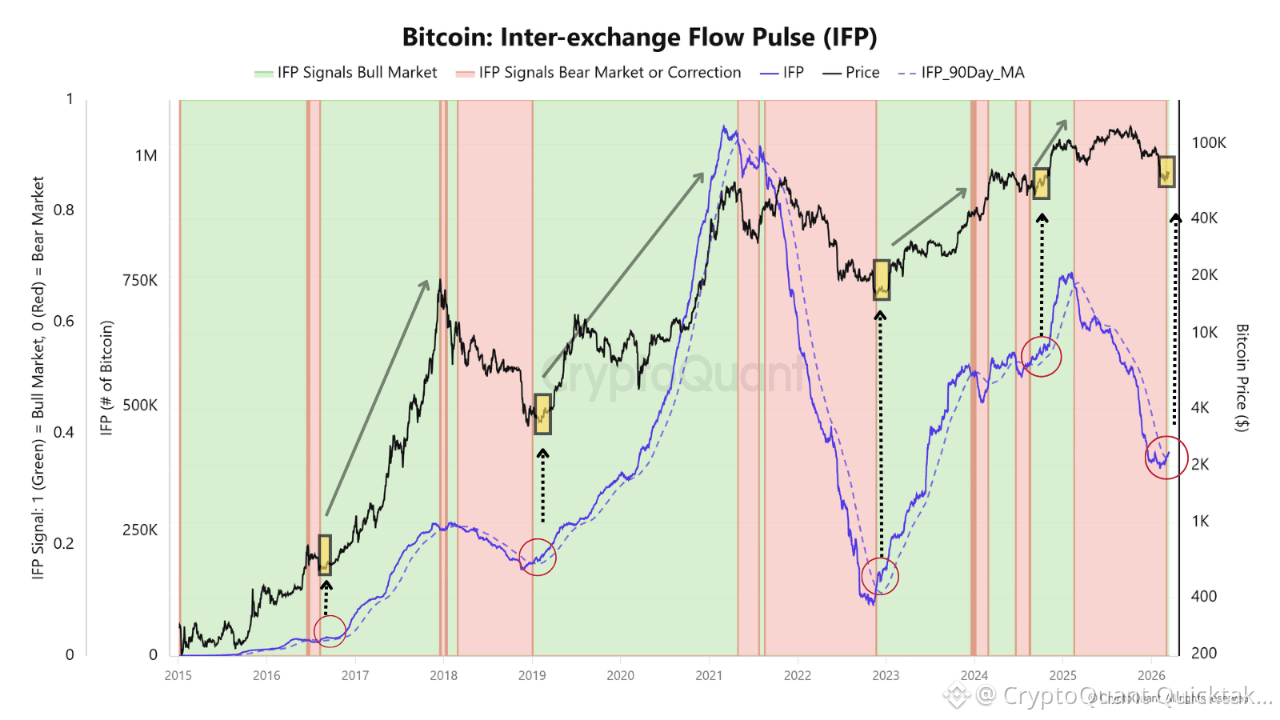
Looking at the long-term chart, most bullish regime shifts occurred after extended periods in which the indicator remained below its 90-day moving average (red zones). Once the metric reclaims the trend, Bitcoin has historically entered sustained expansion phases. These transitions were observed in the early stages of the 2016–2017 rally, again during the 2019 liquidity rotation that preceded the 2020-2021 bull market, and after the 2022 cycle bottom.
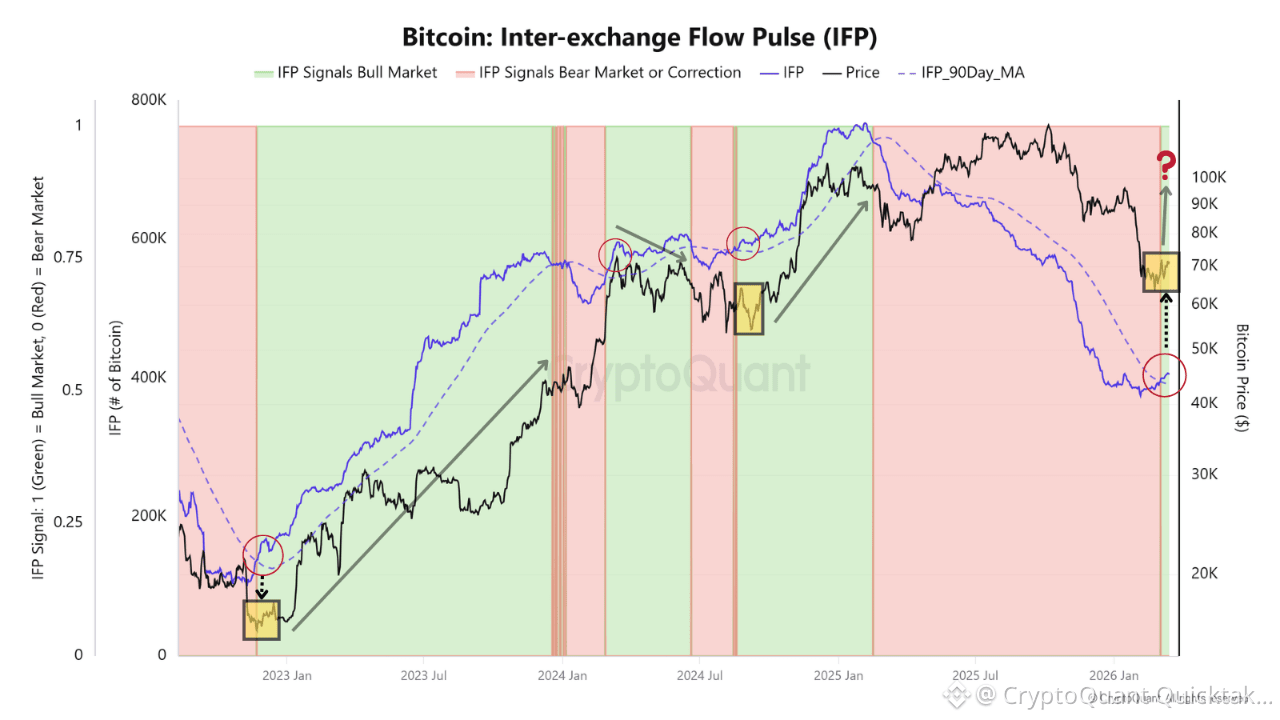
The current signal appears in a similar context. After a prolonged contraction in inter-exchange flows throughout 2025, the indicator has begun to recover and has now crossed its trend filter.
This does not necessarily imply immediate upside or the absence of volatility. Past signals show that even after the regime turns bullish, Bitcoin can still experience sharp pullbacks or consolidation phases. However, historically these corrections have occurred within broader bullish liquidity regimes rather than during structural market declines.
In practical terms, the signal suggests that liquidity mobility inside the exchange network is increasing again, a condition typically associated with early expansion phases of market cycles.
Written by MorenoDV_