
The crypto market has once again shown its brutal iron fist to all high-leverage players.
In the eerie stillness without warning, the sell-off came crashing down like a tsunami. According to the latest market data, both Bitcoin (BTC) and Ethereum (ETH) have faced a recent heart-stopping cliff dive. The brutal red candles flashing on the screen not only devoured countless investors' accounts but also plunged the entire crypto space into a deathly silence.
Open interest is towering high, and the liquidation data is shocking. Many are asking: why did the crypto market, which was initially looking so promising, suddenly drop so much? Is this the end of the bull market, or just a brutal shakeout before the storm? What roles do geopolitical factors, technical divergences, and the whales' chip harvesting play in this situation? Will it continue to drop in the future?
Today, we will combine the global macro situation, the latest news, and the most fundamental technical data to unravel the ultimate truth behind this crash.
Part One: The 'Choking Hand' of Macroeconomic Situations—Geopolitics and Black Swans of Macroeconomic Liquidity No financial asset can exist in isolation from the gravitational pull of geopolitics. The severe flash crash in the crypto market was triggered by the sudden deterioration of the global macro situation.
The worsening US-Iran geopolitical situation and surging oil prices pierce the bubble of risk assets. The core black swan of the current global macro situation remains the renewed escalation of the US-Iran conflict. Once the smoke of war in the Middle East reignites, the whales that don't even play pretend will quickly initiate a repricing of risk and risk assets.
The bloodline suppression of oil: International oil prices (CLUSDT) have soared to $102, influenced by this. The high oil prices not only exacerbate expectations of global inflation reigniting but also act like a dagger, piercing the bubble of high-risk assets represented by cryptocurrencies.
The siphoning effect of risk-averse funds: Although Bitcoin has been dubbed 'digital gold' for a long time, when real 'geopolitical fire' arrives, traditional risk-averse capital still tends to flow towards physical gold and the US dollar. The 'risk asset' property of cryptocurrencies was magnified at this moment, triggering a panic-driven massive capital outflow.
The 'hawkish' turn in Fed rate expectations. Liquidity is the lifeblood of the crypto market. Latest news indicates that due to inflationary shadows brought by oil and the uncontrollable geopolitical situation, the Fed's internal attitude towards the next rate cuts is becoming tougher and more conservative. The market's originally anticipated easing cycle has met a harsh reality check, and the high risk-free rates leave speculative funds trapped at high levels in the crypto market gasping for breath. As global liquidity tightens marginally, BTC and ETH, which are at relatively high levels, will inevitably become the first withdrawal machines for big funds.
Part Two: The Cold Data of Technical Analysis—Capturing the Attraction of Long-Inducing Distribution and Liquidity Gaps Technical analysis doesn't lie; it just faithfully records the crime scene left by the main capital on the charts. Let's dive straight into the latest 30-minute candlestick chart to reveal how the whales utilized technical structures to execute this brilliant distribution.
Bitcoin (BTC): High double top established, liquidated longs become downward momentum. Observe the 30-minute perpetual contract chart for BTC/USDT.

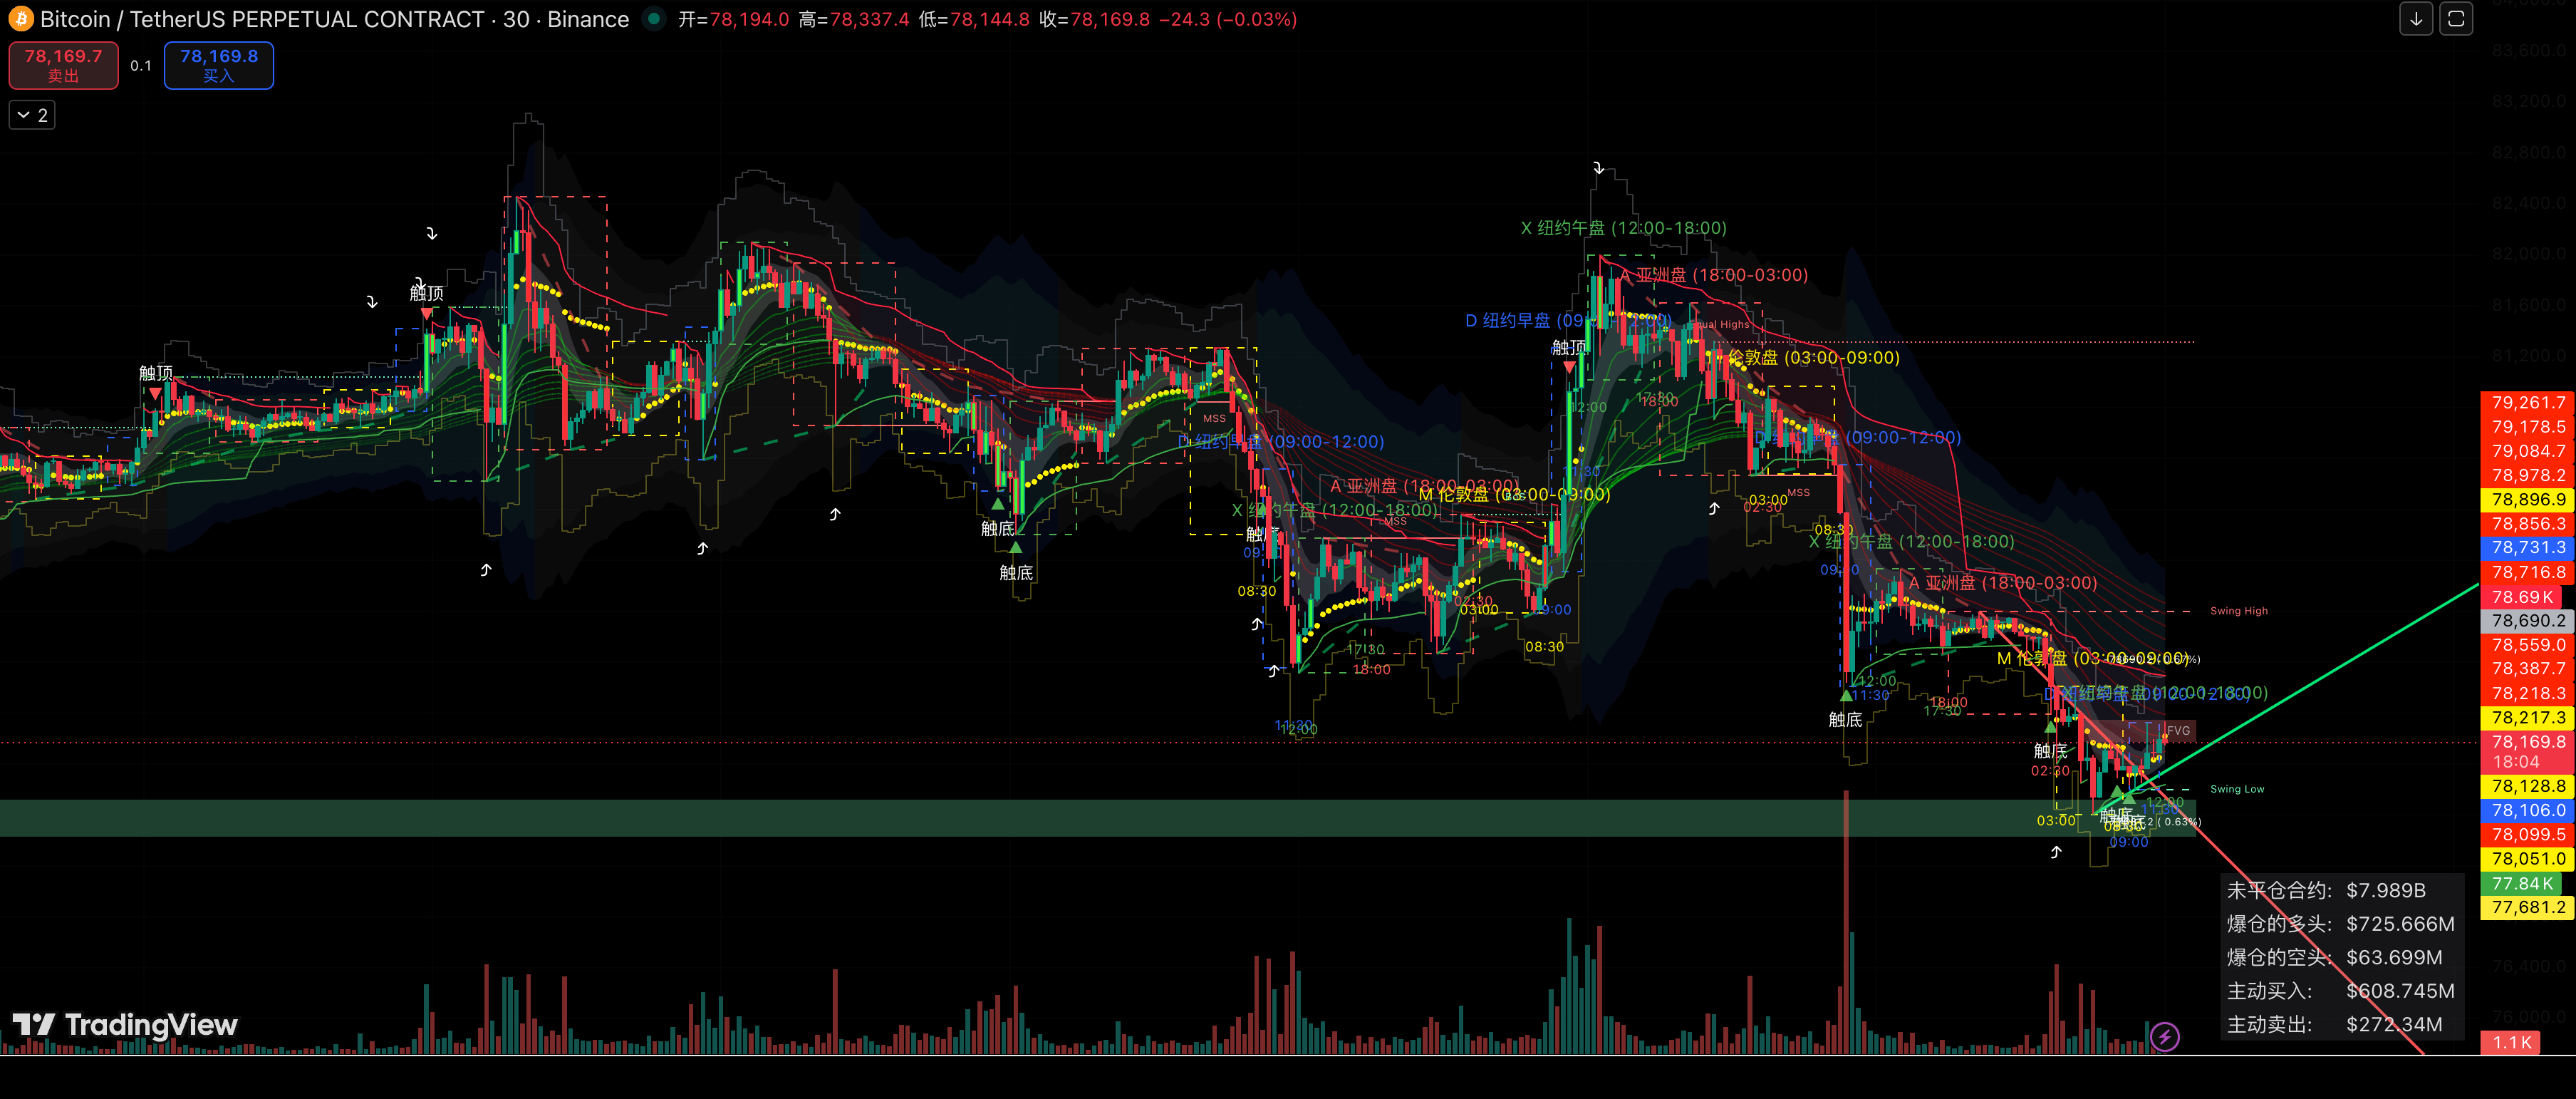
Pretend not to play along: Previously, when BTC surged to around 79,283.1, it formed a very obvious double top structure. The whales repeatedly manipulated the market here, creating a false sense of 'soon breaking through the 80k barrier', luring countless retail investors into high-leverage longs.
Trendline collapse: As you can see in the subsequent movements, the price significantly broke below the green diagonal trendline that marked the lifeline of the bulls. Once the trendline was breached, the trapped positions above instantly turned into selling pressure, triggering a cliff-like crash.
Terrifying liquidation data: Note the bloody code in the lower right corner: open contracts reached $7.995B, while in this wave of selling, the liquidated long positions amounted to $725.666M! This means that the vast majority of high-leverage longs have been ruthlessly slaughtered in this crash, and their stop-loss orders (automatic sell orders) have instead become the best free fuel for the whales to suppress coin prices and shatter the market.
Current position: The BTC price has fallen to the strong support zone of the bottom green FVG (77,681 - 78,128 range). This is the last line of defense that the bulls are desperately trying to hold, and it is also the area where active buy volume ($608.745M) begins to show resistance.
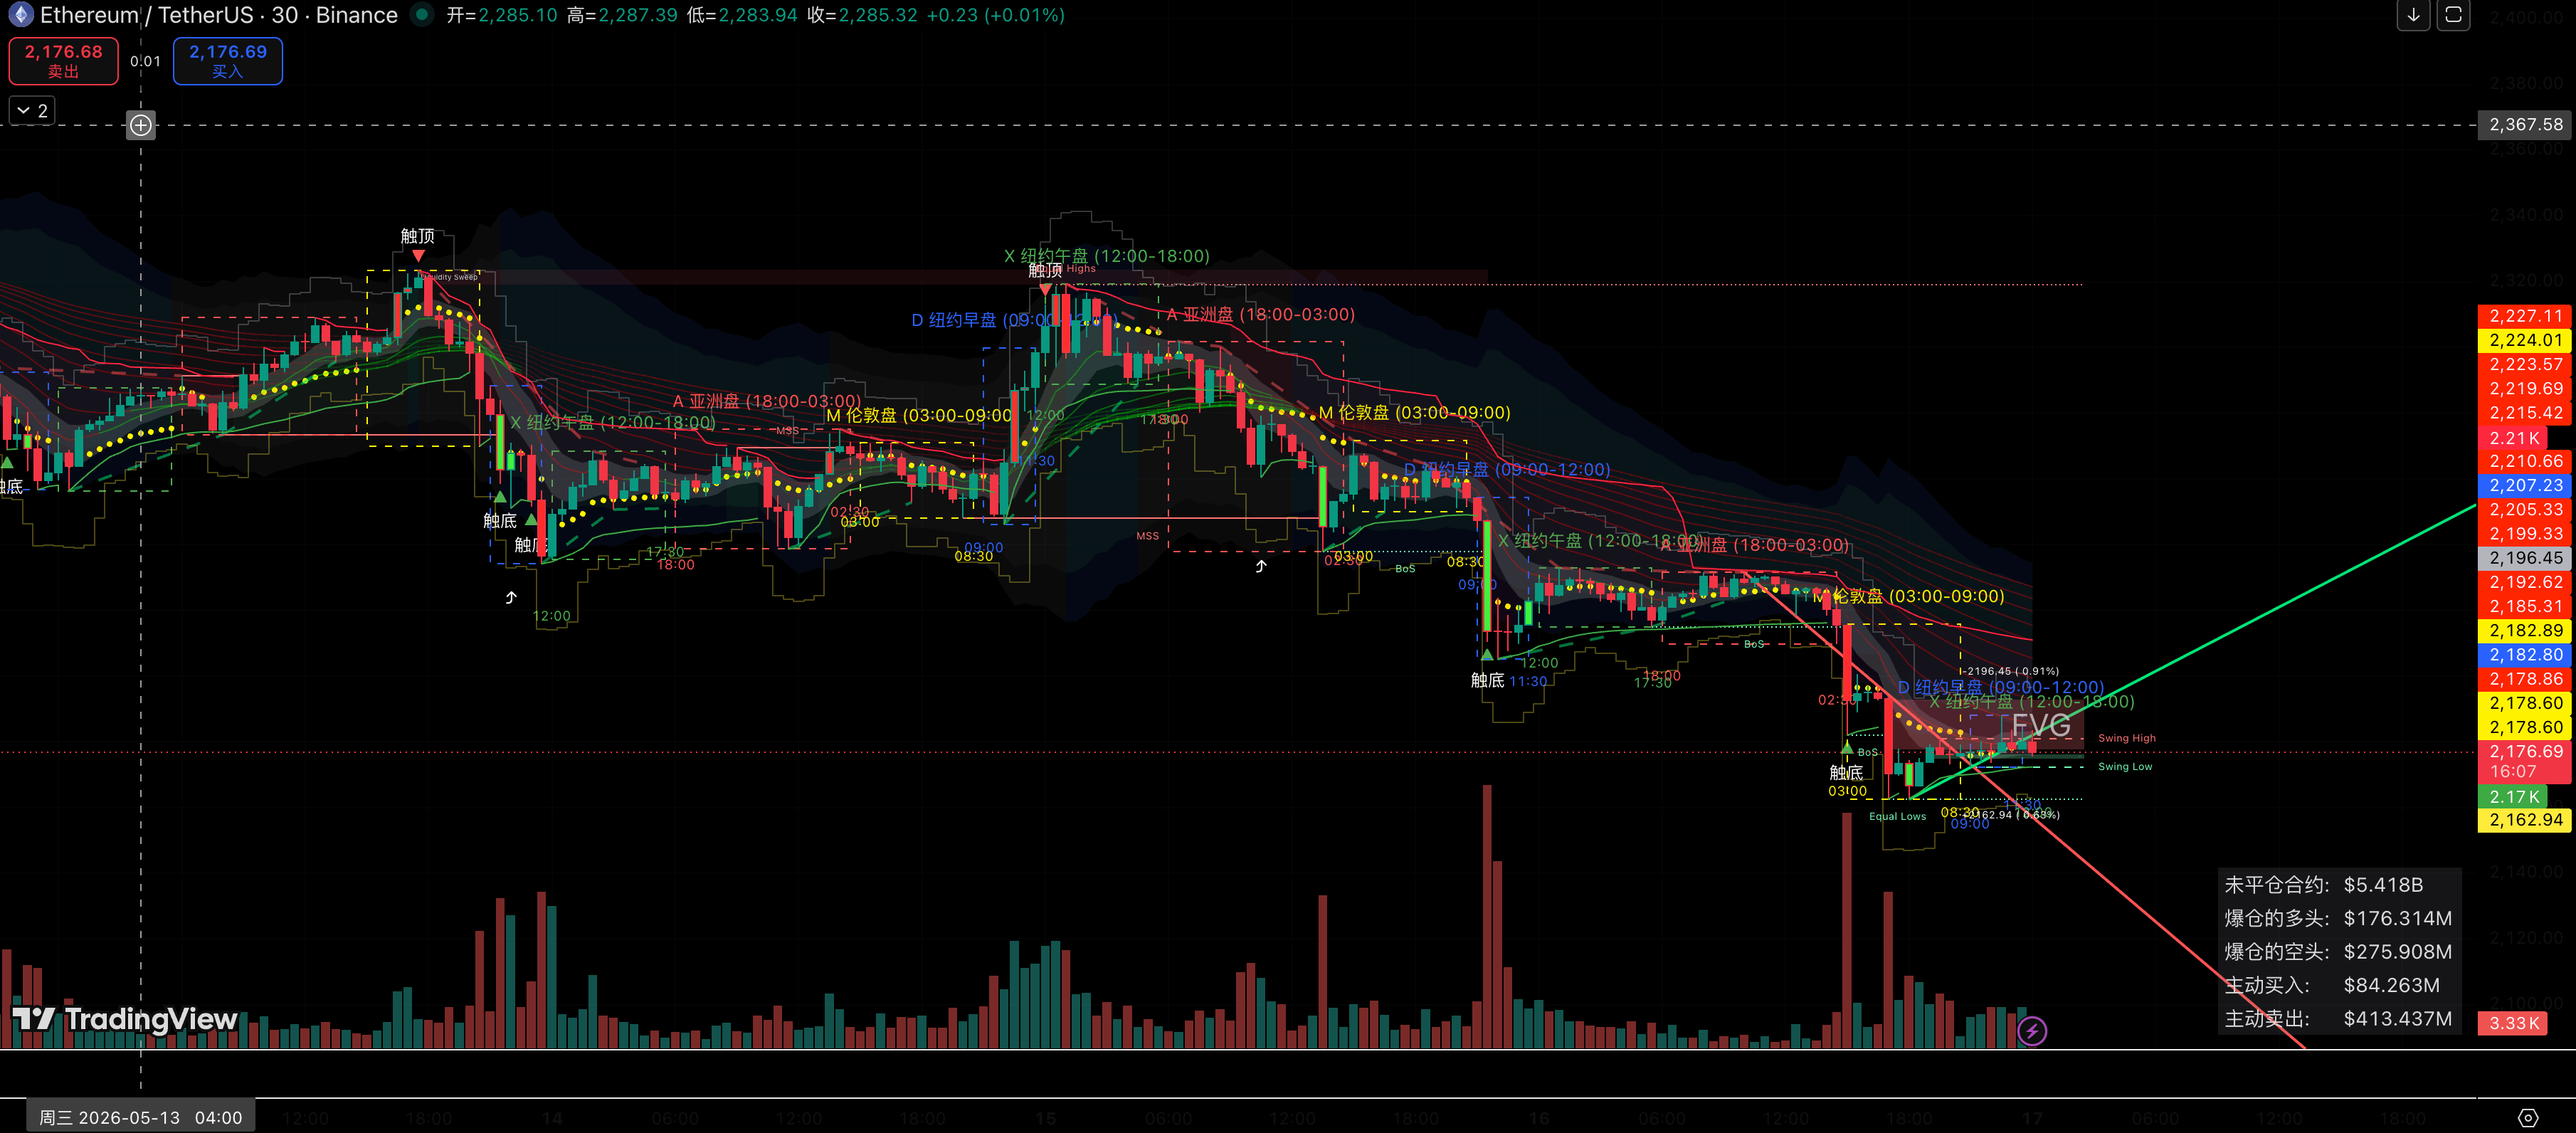
Ethereum (ETH): Difficult to turn back, more brutal long liquidation Compared to BTC, which still has some resistance, Ethereum (ETH) on the 30-minute chart (image_4511e7.jpg) shows a complete 'difficult to turn back' crash pattern:
Perfect arrangement for shorts: The moving average system for ETH has completely transitioned into a bearish divergence. The price has been on a steady decline from the resistance level above $2,240, without any ripples.
Support breached and FVG broken: Currently, the price has not only fallen below the local Swing Low support but has also directly smashed through the originally bullish FVG gap (around 2,179.01). Open contracts reached $5.418B, and ironically, amid such a massive drop, the long liquidation amount ($176.314M) is far lower than the shorts liquidated due to profit-taking, indicating that the bulls in Ethereum's market have even lost the strength to fight back, falling directly into a chain reaction of spot and contract liquidations.
Part Three: The 'Harvest Logic' from the Whales' Perspective—Bloodbath of High Leverage, Blood-Stained Token Exchange The money in the market is conserved; your losses ultimately fill the pockets of the whales. Why drop so much at this time? Because the market is too heavy.
After a series of continuous rallies, the market is flooded with speculators relying on small funds and high leverage (50x - 100x) trying to get rich overnight. Open contracts have long maintained a terrifyingly high level of hundreds of billions, meaning the bulls have significant unrealized profits.
If the whales decide to keep pushing up to 80k, they must scoop up these high-leverage long positions at higher prices with real capital. This obviously aligns with the capital's bloodthirsty and profit-seeking nature. Therefore, the most aligned strategy for the whales is:
Using negative geopolitical news, riding the wave, and artificially creating panic.
Suddenly pulling buy orders at key breakout levels in technical analysis, even actively dumping.
Triggering the first batch of high-position long stop losses, activating the exchange's forced liquidation system.
Liquidated orders automatically convert to market sell orders, thereby automatically smashing the coin price down to the golden pit like dominoes.
The whales calmly absorbed in the green area of the bottom FVG (around BTC's 77,600), using cold limit orders to scoop up the blood-stained spot tokens that retail investors had to sell out of fear.
This is why every crash comes with hundreds of millions or tens of millions in long liquidations. This is not a market out of control; it is a meticulously orchestrated 'de-leveraging' bloodbath by the whales.
Part Four: Ultimate Prediction—Will it continue to drop? Future Long and Short Strategic Simulations Having seen the past and clarified the present, the core question arises: after dropping so much, will it continue to fall?
We must conduct the most rigorous deductions from both long and short dimensions, absolutely avoiding ambiguous word games.
Viewpoint One: A resistance rebound is likely in the short term, but the washout is not yet complete. On a positive note, BTC has precisely hit the strong support zone of the green FVG on the 30-minute level (77,681 - 78,128). Here, the active buying volume ($608.745M) has significantly exceeded the active selling volume ($272.34M). This indicates that there are long-term big funds and institutional whales seizing the opportunity to buy the dip. Therefore, there is a high probability that we will replicate yesterday's 'perfect needle' scenario, leading to a rebound from oversold conditions.
However, from a pessimistic perspective, the open contracts in the market (BTC $7.99B, ETH $5.41B) did not experience a significant shrinkage due to this wave of selling. This indicates that the bulls have not completely given up, as retail investors looking to buy the dip and leveraged holders still exist. As long as the geopolitical alarms (surging oil prices, US-Iran conflict) are not lifted, the whales may attempt another deeper 'needle' action after facing resistance at high levels.
Geopolitics is the wind, technical patterns are the bones, and liquidation data is the blood.
In this bloodthirsty slaughter orchestrated by international politicians, Wall Street whales, and exchange operators, the only way for retail investors to survive is to abandon faith, respect the trend, and strictly set stop losses.
Just like yesterday, the market was harshly smashed down to 76,500 under the perfect contract needle, and Qingfeng directly helped the group members accurately take profit on their shorts, flipping to long and capturing the rebound, making profits from both sides. Opportunities in the market are far more abundant than you think; the key lies in whether you have an extraordinary keen perspective.
Keep an eye on oil prices, guard the green zone. Every day, follow BenQin (Qingfeng) to execute a few trades and see through the whales' tricks, and in this brutal market, you can also be carefree and at ease!
Trade here, follow the clear wind and don't get lost 👇