
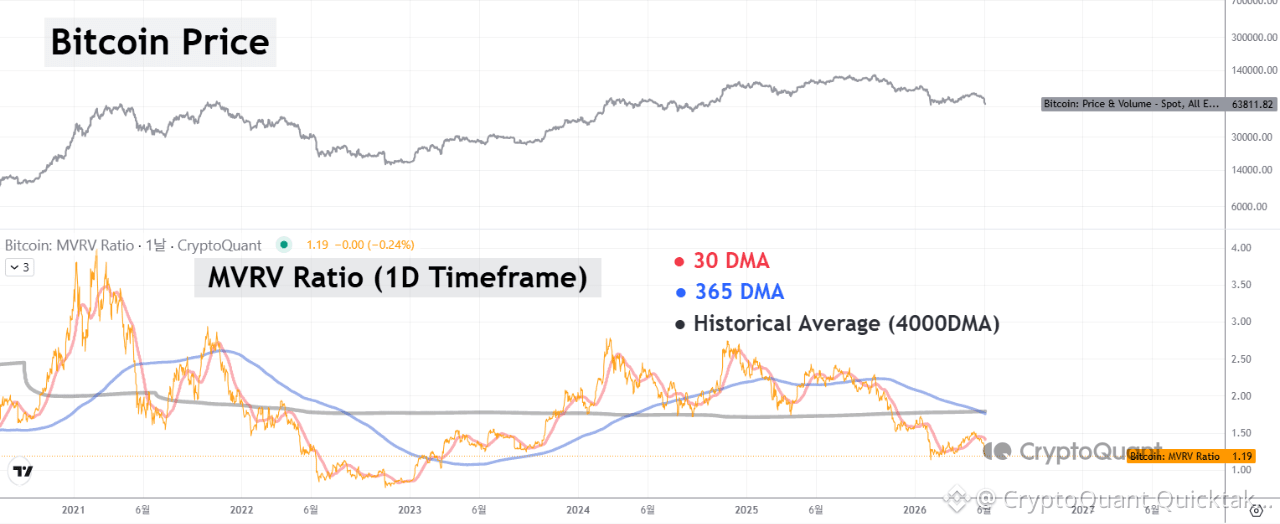
The MVRV (Market Value to Realized Value) ratio is a key metric used to gauge market profitability. A value below 1.0 indicates that the asset is undervalued, while a rising value above 1.0 suggests it is becoming increasingly overvalued.
Currently, the MVRV has decreased further, sitting at 1.19.
What we need to pay close attention to right now is the relationship between the 365DMA (blue line 🔵) and the middle black line ⚫. Additionally, the solid gray line at the bottom represents the 4000DMA, which serves as the overall historical average of the MVRV over the past decade.
If we look back at the 2022 cycle, around August 2022, a "death cross" occurred between the black line and the blue line. This signaled that the market was entering the latter half of the bear market—essentially, the bottom consolidation phase. Following this period, a "golden cross" emerged between the blue line 🔵 and the red line 🔴, which marked the gradual transition back into a bull market.
Recently, we observed a death cross between the 4000DMA and the 365DMA. While this indicates that there is still a possibility for further downside, it also strongly suggests that we are entering a phase where a gradual accumulation strategy, such as Dollar-Cost Averaging (DCA), could be highly effective.
Written by Yonsei_dent