
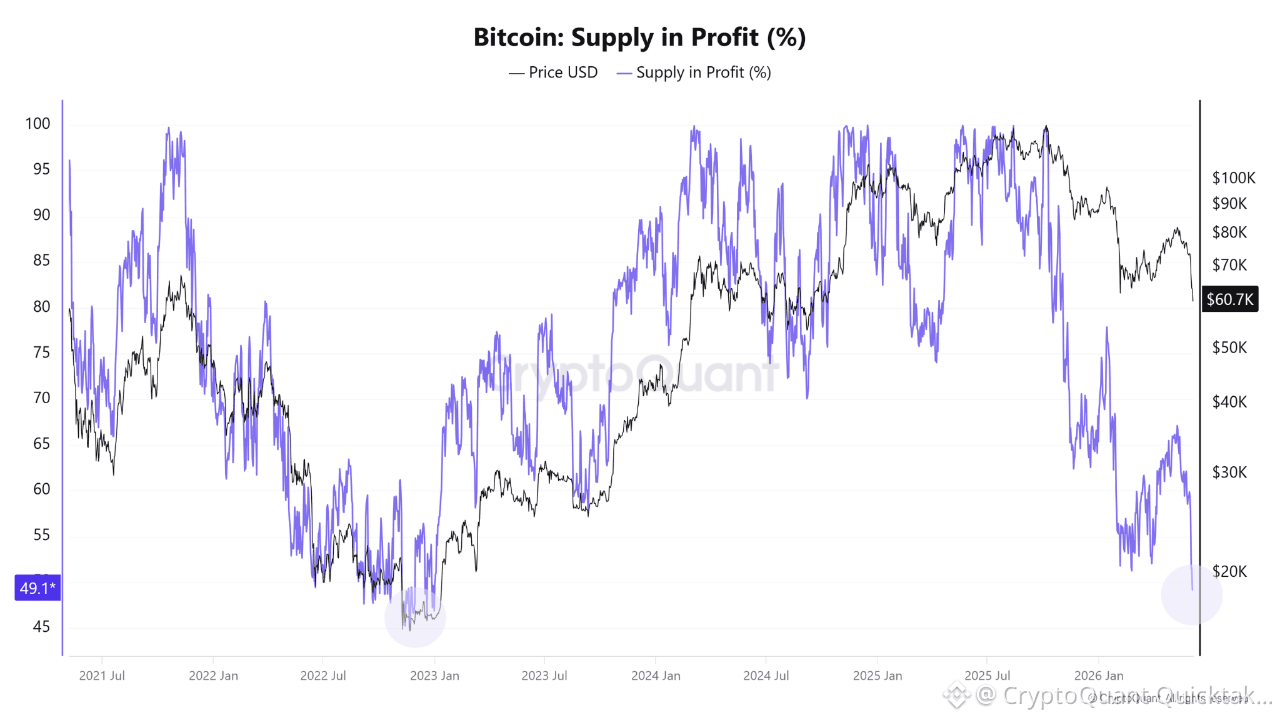
- Based on data from the Bitcoin Supply in Profit chart, I am observing a highly notable on-chain data structure: The $BTC Supply in Profit (%) metric has dropped deeply to 49.1%, even as the price maintains around the $61.8K region.
- Throughout the history of previous cycles (typically 2015, 2018-2019, and late 2022), the Supply in Profit metric falling below the 50% threshold has often been associated with "capitulation" phases. This is the period when the majority of the market is underwater, panic sentiment is high, and sellers are gradually exhausted.
- The unique aspect of the current cycle is that the 49.1% mark appears while $BTC is priced at $61.8K, significantly higher than previous macro bottoms. This data indicates that a massive amount of Bitcoin has changed hands, shifting the cost basis to price zones above $60K over the recent period.
- History proves that zones below 50% typically present long-term accumulation opportunities. However, given the market's current high cost basis, the tug-of-war will likely continue. It is necessary to monitor further signals of new capital inflows or a sharp surge in this metric back above the 50% mark to confirm clearer recovery momentum.
Written by Rei Researcher