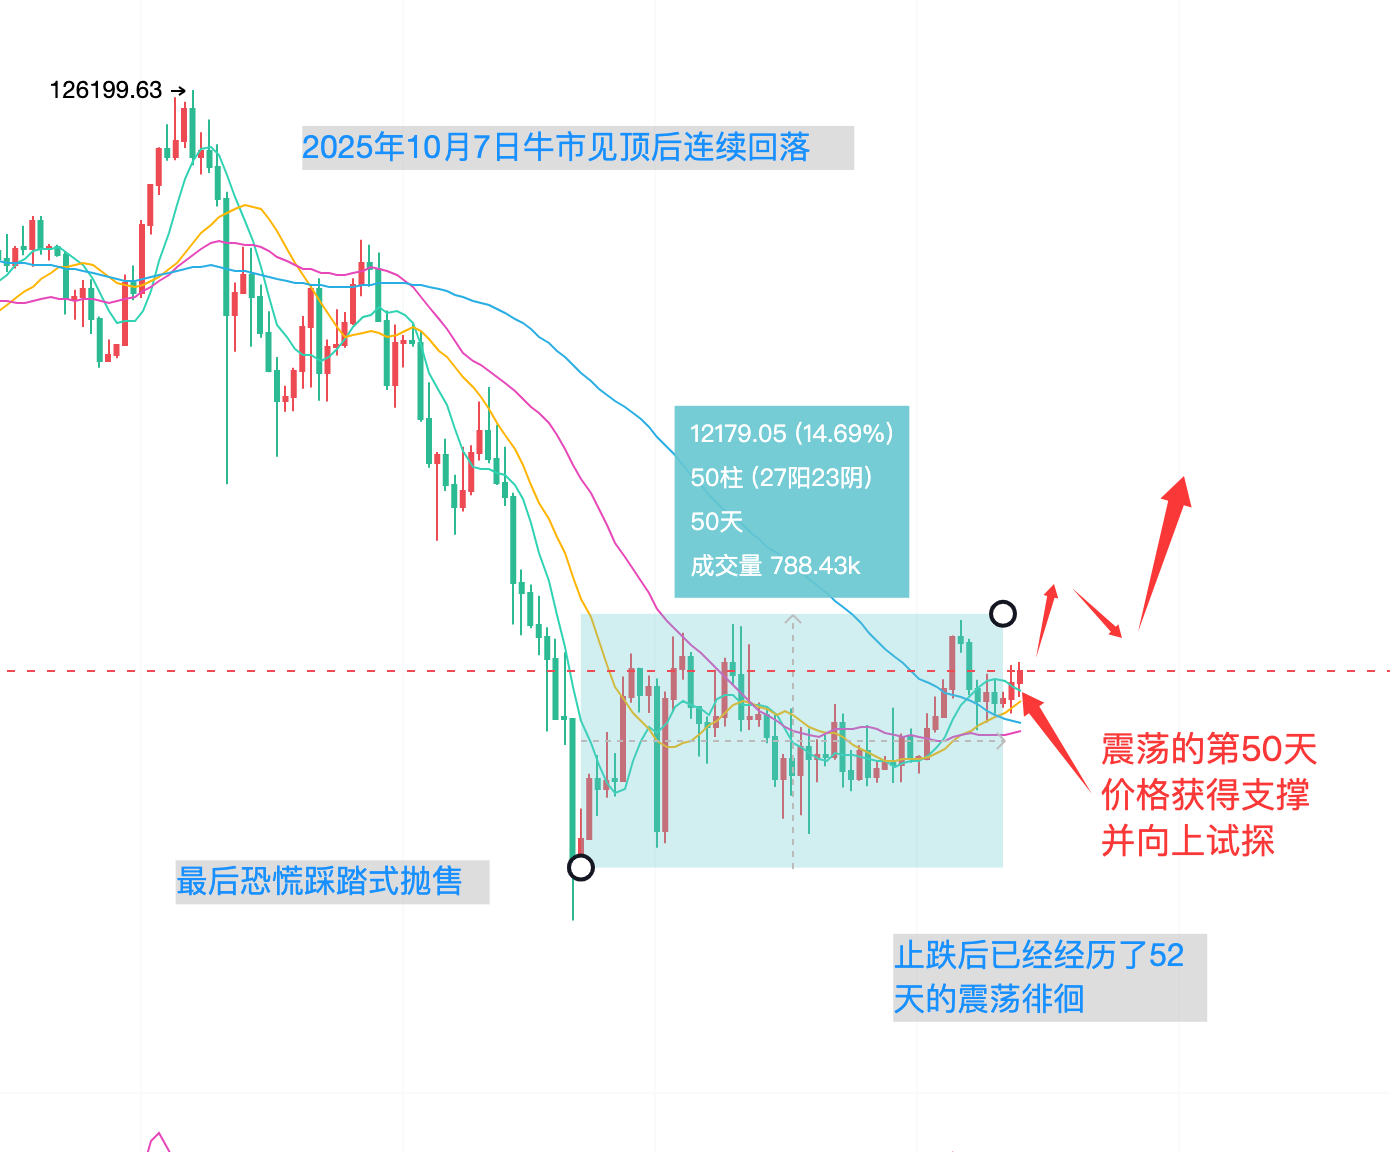
$BTC BTC has been oscillating above the low of $80,000 for 52 trading sessions since its final sharp drop on November 21 last year. During this period, the price, which initially experienced significant volatility within the first 10 days of stabilization, has gradually become more stable, with market panic further alleviated. Meanwhile, selling pressure has been fully released through extensive selling, and the prolonged consolidation has allowed for thorough turnover of positions, resulting in stronger holding patience among market participants.
On the latest daily chart level, the candlestick has already risen above both MA30 and MA60, marking the early stage of breaking free from the downward channel. From the candlestick pattern perspective, since the low point of $84,500 on December 19 last year, the bottom has slightly shifted upward, indicating that buying pressure is eager to enter the market, and bullish forces are beginning to rebound and release energy upward.
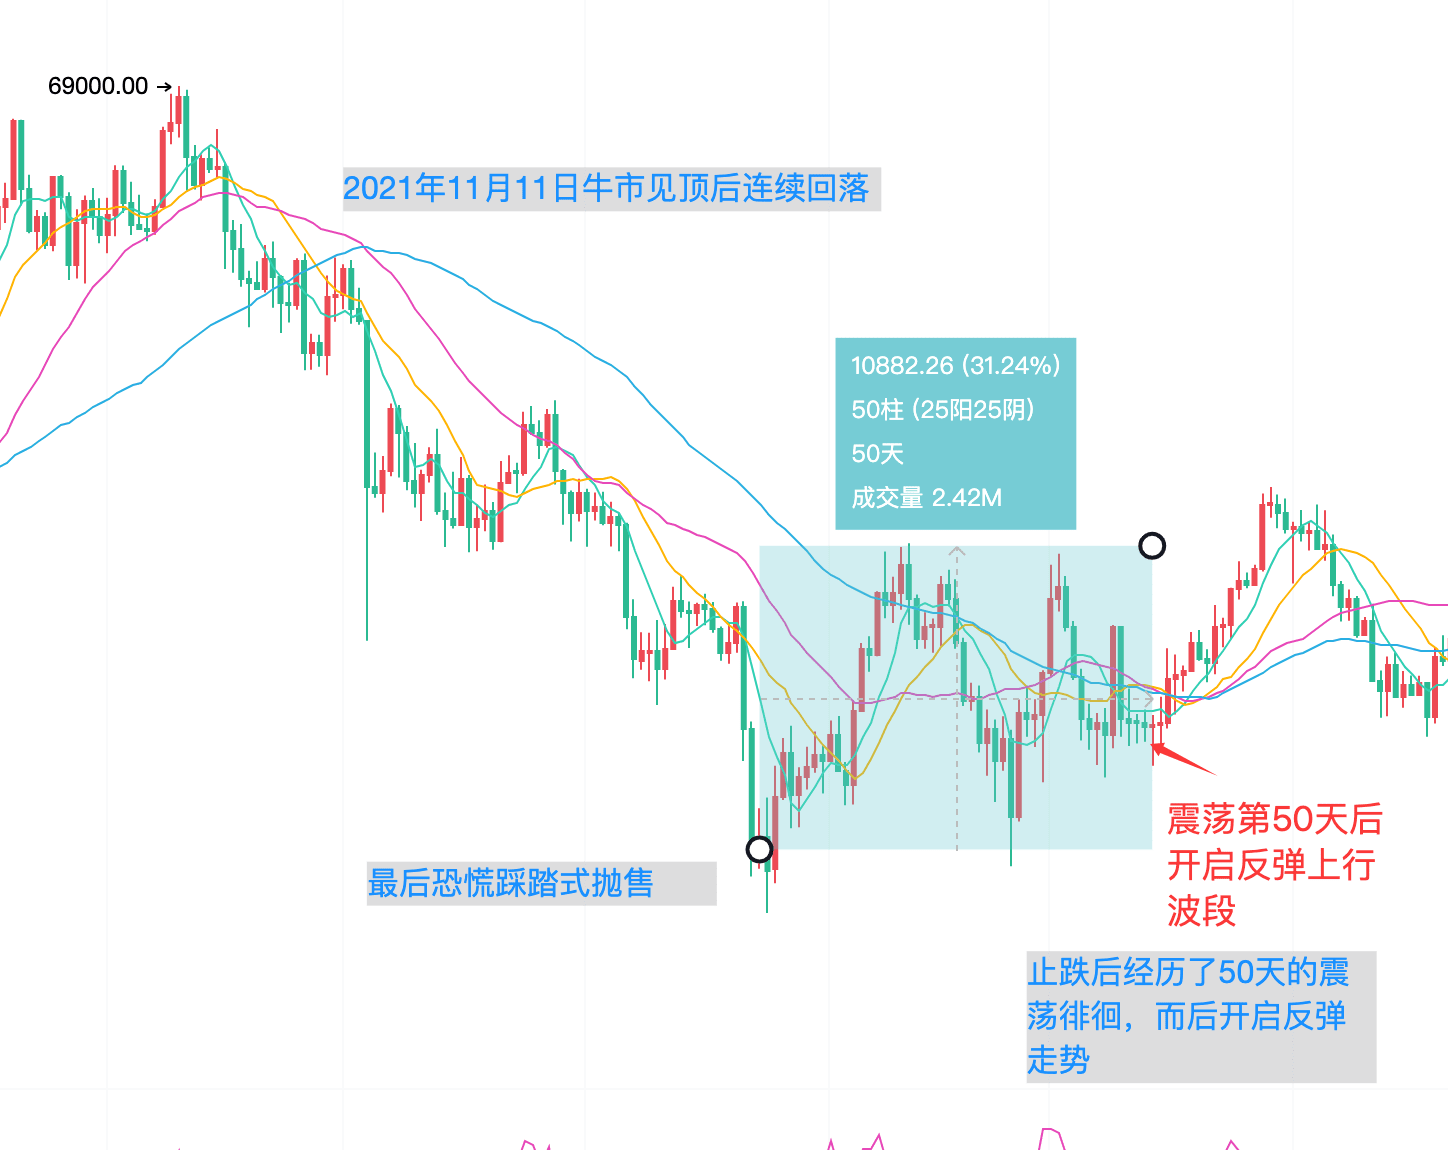
Although we are currently in a bear market phase, the bear market is not a continuous and urgent decline. The medal believes that after a significant decline, a release of bullish buying pressure is understandable to delay the bear market cycle. If we deeply predict based on BTC's trend from late October to mid-November last year, it would actually take less than four months to complete the entire bear market process, which is somewhat unreasonable and difficult to shake off loyal holdings. Due to the rapid decline and short duration, intermediate consolidation and upward release of buying energy are inevitable. Therefore, the medal infers that in the short term, BTC's price still has a high possibility of turning towards a bullish market, forming a clear upward path.
Of course, the trading methods here and the medals reference the posture after the initial decline in the previous bear market. Everyone should refer to the historical basis when looking at the medal's chart. The medal indicates that the time for the next price increase is quite close. Because from the details, the price started leading a small upward trend on January 1st of this year. On January 6th, it reached the upper boundary of the daily consolidation around $94,500, and then there was a noticeable pullback. This behavior is a clear attempt to test the upward market. The pullback is to shake out positions, to flush out bottom buyers, and also to reduce the difficulty of the main force's escape during the subsequent rally.
Currently, after BTC's price peaked and pulled back near $94,600 on the 6th, it has undergone a recovery around $90,000, reigniting bullish confidence. The price is beginning to test upwards again, indicating a significant likelihood of breaking through the upper boundary of consolidation at $94,600 and moving towards the $100,000 mark. For friends who are trading short-term, conservative investors can choose to accumulate long positions in the support area of $89,000 to $91,000. For those who are similarly optimistic about a bullish rebound, they can enter around $91,500. For right-sided traders, directly following long positions after a strong breakout above $95,000 is also feasible.
Considering the current situation, it is seen as a rebound wave in the bear market. It is recommended to focus on long positions during pullbacks when the price is below $94,000. After the price tests the resistance boundary near $94,500 again, short positions can be considered. For the peak position of the medium-term rebound, the medal predicts a range of $104,000 to $107,000.#比特币 #BTC走势分析