📌  BTC 1D Timeframe Analysis
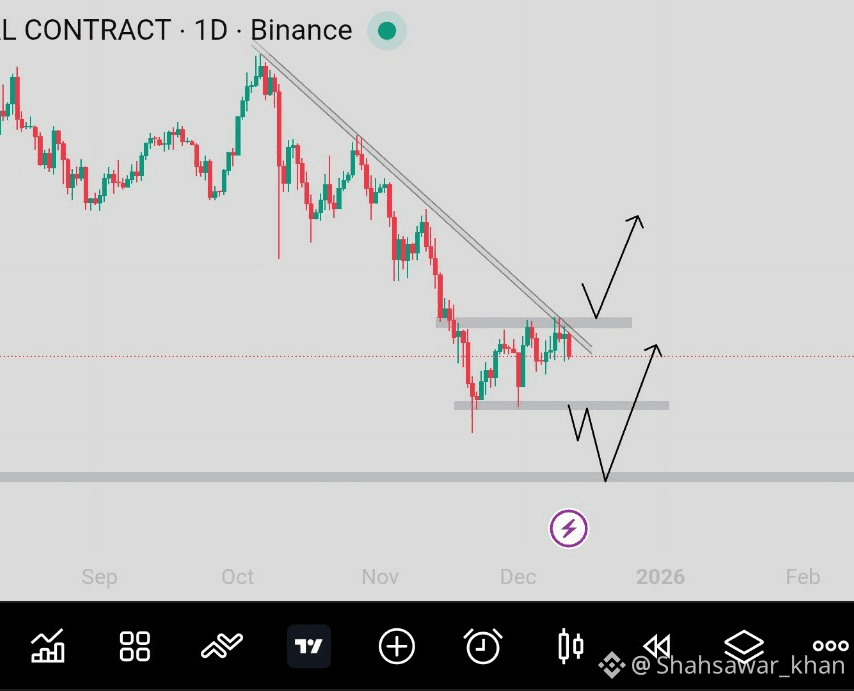
Price is currently consolidating just below the descending trendline, creating a short-term compression zone. The lower grey zone represents a liquidity pool, where previous wicks indicate that sellers have left resting liquidity. If price sweeps this liquidity and taps into the demand zone, we can expect a strong bullish reaction.
Two possible scenarios:
🔼 Bullish Scenario
Price breaks above the descending trendline.
A successful break & retest of the upper grey zone confirms bullish momentum.
After retest, continuation toward higher levels becomes likely.
🔽 Bearish Liquidity Sweep Scenario
Price first drops into the lower liquidity zone to grab liquidity.
A sharp wick or rejection from this zone signals demand.
After sweeping liquidity, price can reverse strongly upward.
Overall, the chart suggests that the lower level is a liquidity zone, and once that liquidity is collected, BTC has potential to move upward with strong momentum
#BTC #analysis #TrendingTopic #WriteToEarnUpgrade #TrumpTariffs $BTC
