Around 10 PM Beijing time, the market trend sharply declined, and Bitcoin faced strong resistance, quickly falling below the $74,000 threshold, dipping as low as around $73,300. Meanwhile, Ethereum also did not escape, following the market plunge and losing the important psychological support level of $2,300, causing market sentiment to shift instantly from optimistic to cautious.
This sudden sharp decline caught many contract investors who were bullish about the market off guard, leading to a massive wave of liquidations in the derivatives market. In the past 24 hours, a total of up to 137,000 people across the cryptocurrency network suffered liquidation. The total amount of liquidation surged to $350 million, indicating that the strength of the market's bearish counterattack is extremely strong, with long positions becoming the primary victims.
Bitcoin four-hour chart
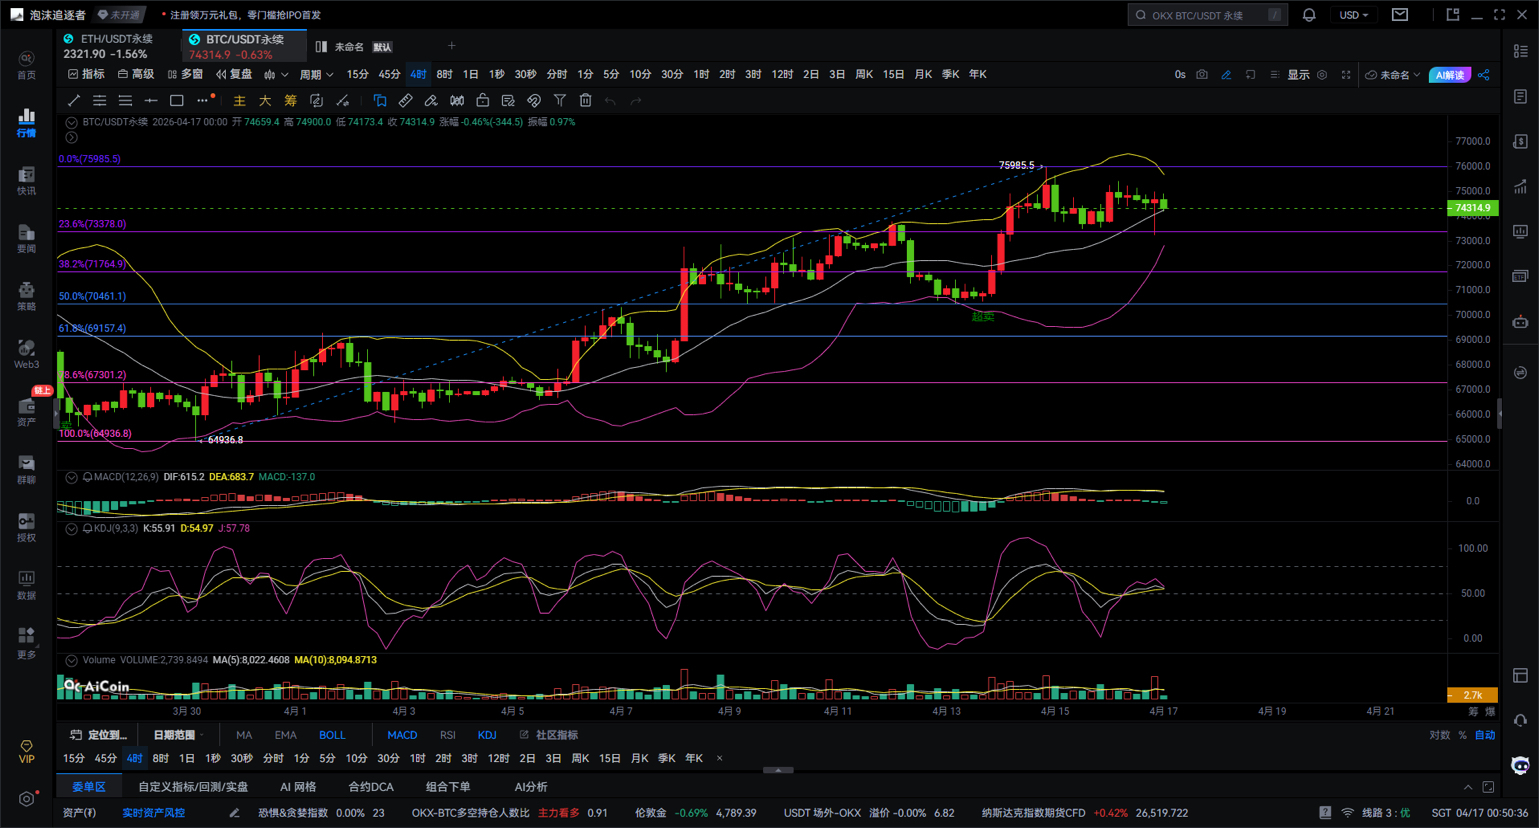
Bitcoin's current situation is that it is horizontally moving at a high level, accumulating strength. The overall direction still looks bullish, but the short-term price is a bit high, and there is a need for a downward adjustment. In simple terms, the big trend is not wrong, but don’t rush to chase high in the short term; either wait for it to pull back or wait for it to clearly break upwards before proceeding.
The key thing is to look at the Fibonacci lines. Draw from the previous low of 64936 to the high of 75985. Now the price is hovering around 74314. Where is it currently stuck? Just a little above the pullback level of 73778 at 0.236. This reveals a signal: in a strong market, pullbacks are often shallow; the main force is reluctant to let prices drop too low to benefit retail investors. The resistance above is the previous high of 75985, and the support below is first at 73778 (0.236), then stronger at 71765 (0.382), and further down at 70461 (0.5) which is an even stronger support.
Looking at the Bollinger Bands, the middle line is tilting upwards, and the price is steadily sitting above this middle line, which is a good sign, indicating that the upward trend framework is still intact. However, the upper line is starting to converge towards the middle, which is called a squeeze. This means volatility is decreasing, and the market is building momentum, preparing to choose a direction. After the squeeze, there are usually two paths: either breaking out upwards to challenge the previous high of 76000; or failing to hold and breaking below the middle line, pulling back to the range of 73000-71700.
On the MACD indicator, the red histogram is getting shorter, and the DIF and DEA lines are almost sticking together at high levels. This indicates that the upward momentum is weakening, and the market is entering a phase of rest and adjustment. This does not mean that we will see a sharp decline, but it clearly tells you: now is not the time to comfortably buy; instead, one should patiently wait for the price to pull back before considering where to enter.
The KDJ indicator shows three lines entangled around 50, with the J value slightly rising. This reflects that both bulls and bears are evenly matched, but the bulls have a slight upper hand.
Overall, the expert predicts that the next move is likely to be in two phases. The first phase: first oscillate in the small range of 74000-74800, shake out the uncertain chips. The second phase: after the oscillation, a direction must be chosen.
A stronger scenario (I think the probability is higher): If it can stabilize at 74500, there will be a chance to push up, first looking at 75200, then at the previous high resistance level of 76000.
A weaker scenario: If it breaks below the key level of 73700, it may pull back down, first looking at 73000, then at 71700.
When it comes to practical strategies, the expert offers you two suggestions. The long position is the priority: first, wait for a pullback to around 73700, and buy once there are signs of stabilization, with a stop loss at 73200 and a target at 74800 or 75900. Second, if prices strongly break above 74800 and stabilize, you can follow the trend to go long. The short position, however, is only suitable for experienced traders to try lightly: if the price hits the area of 74800 to 76000 but cannot break through, and a weakening signal appears on a smaller time frame (like 15 minutes), consider a light short position with a target looking back at 73700.
So can we take action at this position of 74300? The expert says directly: this is not the optimal point to chase long. If going long, the potential profit and risk ratio is not very favorable; if going short, it is against the overall trend, which carries considerable risk.
In conclusion, the true expert does not constantly enter and exit the market, but only acts when they have an advantage and the odds are right. The optimal strategy now is to patiently wait for a pullback to around 73700 to buy low, or to wait for a clear breakout above 74800 to chase.
Giving you a 100% accurate suggestion is less valuable than providing you with the correct mindset and trend. Teaching someone to fish is better than giving them fish; it’s suggested to earn for a moment, but learn the mindset to earn for a lifetime!
Writing time: (2026-04-17, 00:50)
(Written by the expert) This is to declare: Online publishing has delays, and the above suggestions are for reference only. Investing carries risks; proceed with caution!
