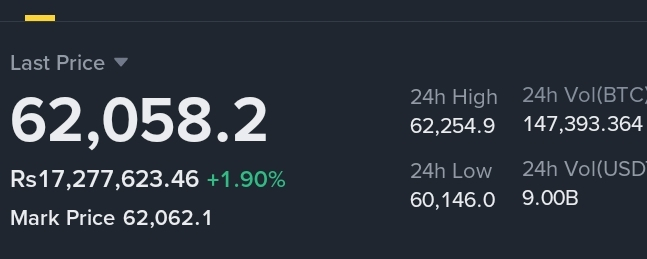
I've been studying the BTCUSDT perpetual chart, and the current setup around $62,058 is quite interesting. Bitcoin is trading just below the session high of $62,254, while the daily low sits near $60,146. That means price has already recovered significantly from the lower range and is still holding most of its gains.
What catches my attention is how Bitcoin is interacting with the MA60 at $62,079. The market is trading slightly below this moving average, suggesting that buyers are still active but have not yet regained complete control. Several attempts to push higher were visible during the session, yet each move toward the $62,160–$62,250 resistance zone faced selling pressure.
Volume behavior is also worth noting. Earlier buying activity helped drive the move upward, but recent candles show lighter participation. In my experience, declining volume near resistance often signals that traders are waiting for confirmation before committing to larger positions.
From a technical perspective, I see immediate support around $62,000, followed by a stronger support area near $61,900–$61,950. As long as Bitcoin remains above these levels, the short-term structure remains constructive. On the upside, a clean breakout above $62,250 could open the door toward the $62,500–$62,800 region.
My view is that Bitcoin is currently consolidating after a strong recovery. The market does not look weak, but it also lacks the volume needed for an immediate breakout. A decisive move above resistance or below support will likely determine the next meaningful trend direction.
Current Price: $62,058
Resistance: $62,250 → $62,500 → $62,800
Support: $62,000 → $61,950 → $61,900
This is my personal analysis based on the chart provided and should not be considered financial advice.
