
 #Bitcoin has now closed three consecutive weekly candles below the 100-week moving average.
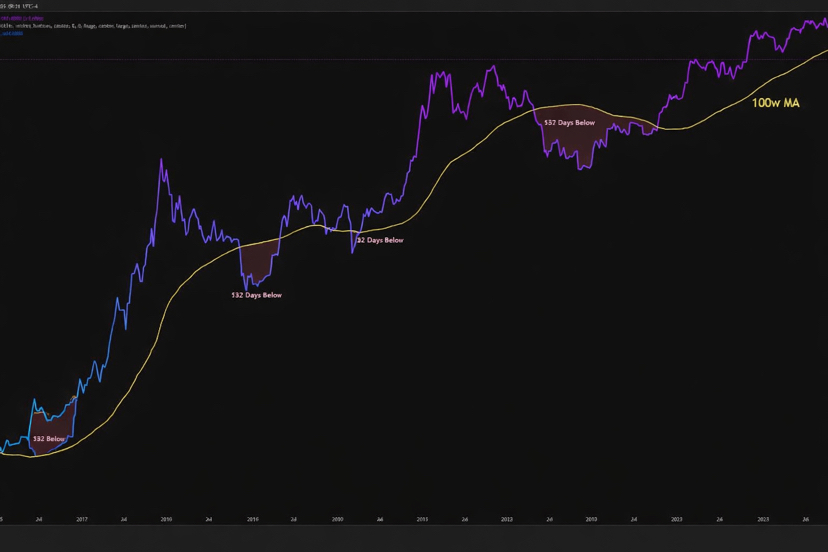
As of writing, BTC has spent 13 days below this long-term trendline. Historically, whenever $BTC falls under the 100-week MA, the average duration spent below it is around 267 days.
The shortest instance was just 34 days, which occurred during the extreme COVID crash — a highly exceptional event.
So if we look strictly at historical data, the odds favor more time below this level, not less.
A sharp recovery isn’t impossible, but the longer price remains under the 100-week MA, the lower the probability of a clean V-shaped rebound becomes.
From my perspective, this is still a phase that calls for patience over anticipation. Expecting an early trend reversal here is premature.
