
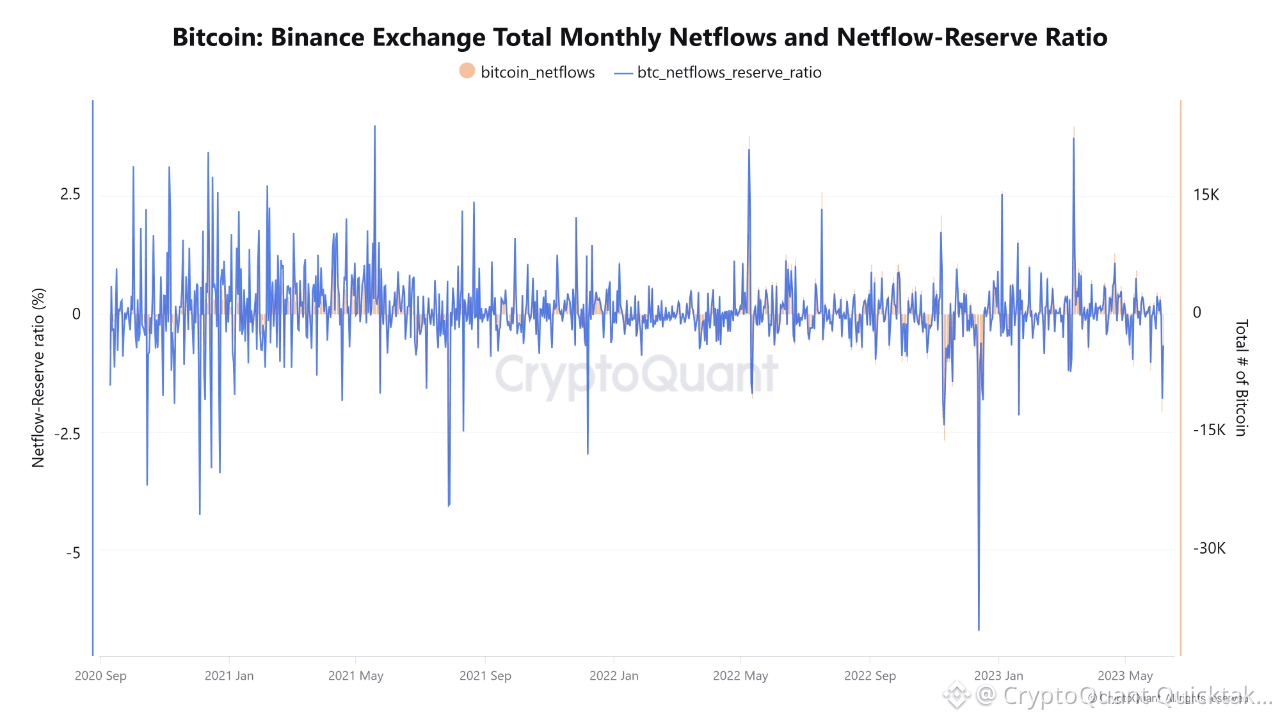
On the Bitcoin side, netflow is positive, and the reserve ratio is also trending upward. This indicates an extraordinarily large inflow of BTC into Binance. Moreover, this inflow is significant relative to reserves, meaning there is a substantial increase in supply. Following the Iran-U.S. ceasefire news, the price rise accompanied by this increase in supply suggests that the amount of BTC ready to be sold has sharply increased. This implies that investors still lack confidence in the market and are waiting for price increases to sell their BTC holdings. This picture is concerning.
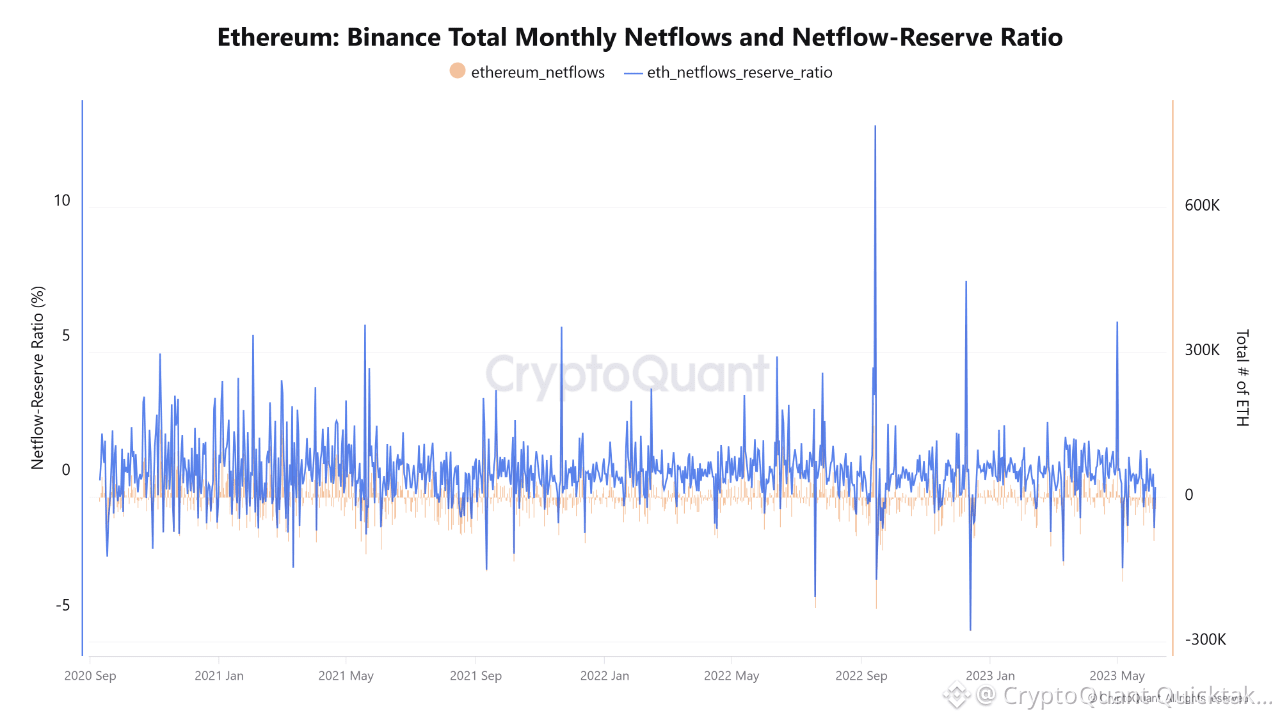
On the Ethereum side, unlike Bitcoin, netflow is slightly negative, while the reserve ratio remains weak around the 0 level. In other words, there is no clear selling pressure. At the same time, there is no strong outflow from Binance either. Supply is close to equilibrium there is neither significant selling pressure nor a strong demand signal. This suggests that Ethereum may remain stronger relative to Bitcoin.
If we compare the two charts:
▪️ While net selling supply is increasing in BTC, supply in ETH remains more neutral
▪️ Exchange liquidity is rising in BTC, indicating preparation for selling, whereas ETH liquidity is stable, pointing to a more sideways expectation
▪️ Reserve ratio movements in BTC are strong and impactful, while in ETH they are weak and less effective
As a result of this comparison, Bitcoin appears to be under noticeably higher supply pressure in the short term, which may tilt the market toward the selling side.
On the other hand, Ethereum and altcoins show no clear direction and face less selling pressure compared to BTC. In other words, Bitcoin is likely to be more affected by selling than altcoins. This indicates that the market is not moving in sync between Bitcoin and altcoins.
Written by PelinayPA