Bitcoin (BTCUSD) is staging a strong rally this month, following the first green month (March) after 5 straight red. So is this the bottom? Not quite based on the Halving Cycle's Theory.
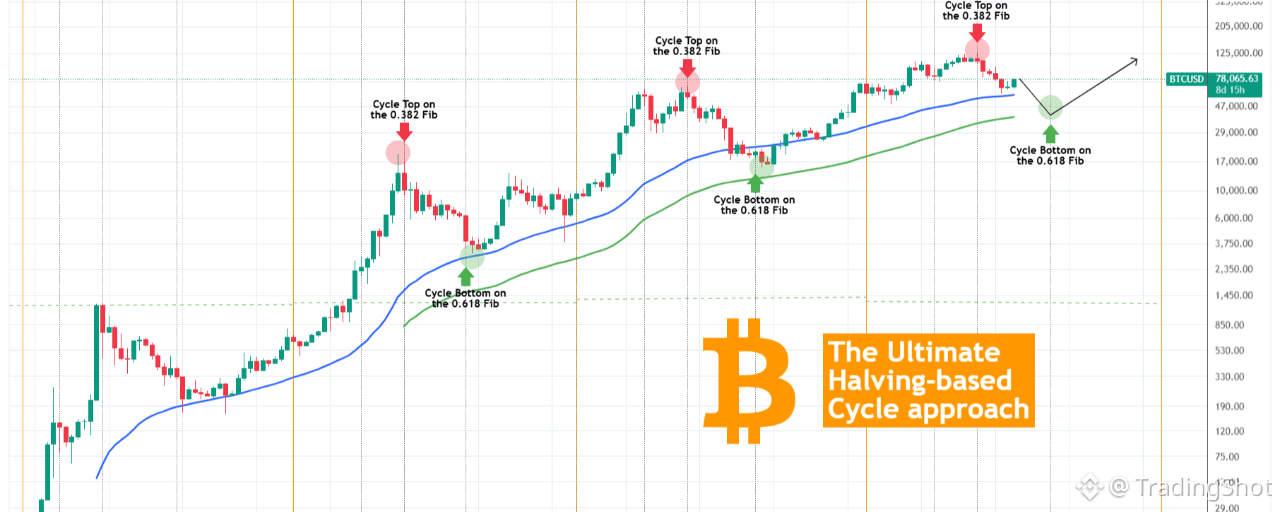
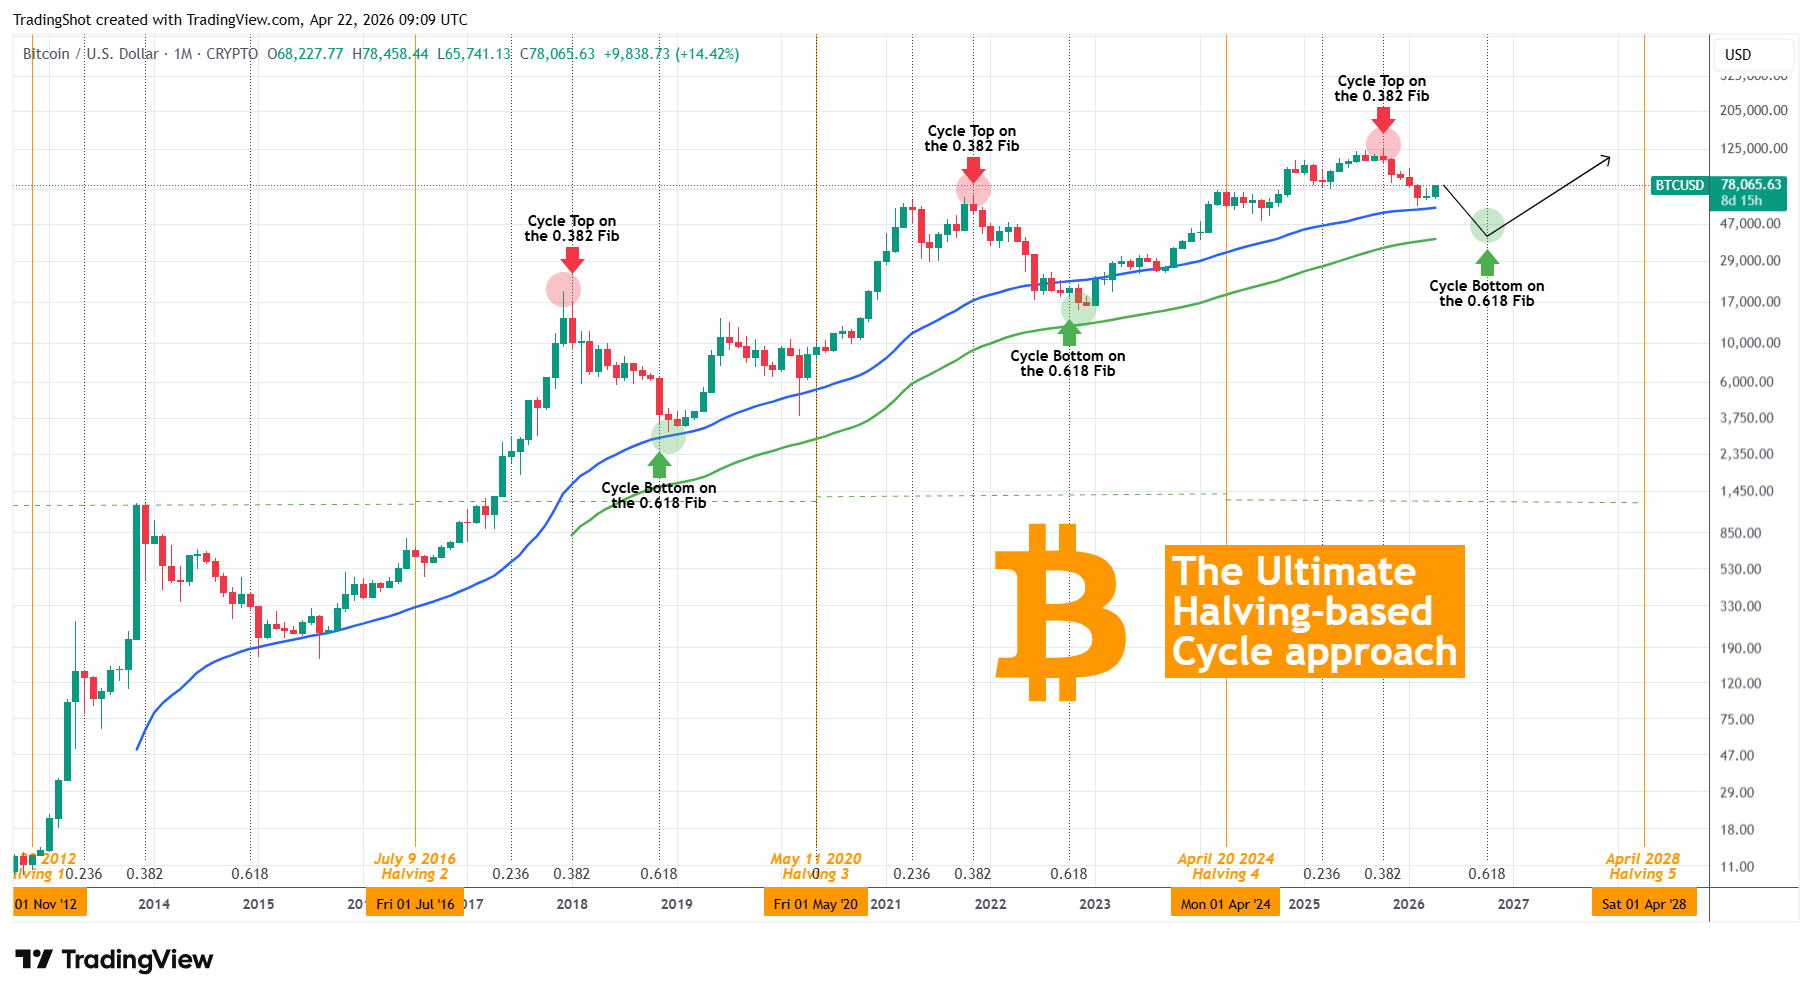
On this chart you can see that since the July 2016 Halving, every Bull Cycle Top was priced on the 0.382 Time Fibonacci level (red circle) between Halving dates. Similarly the Bear Cycle Bottoms were priced on the 0.618 Time Fib (green circle).
Right now the market found Support exactly on the 1M MA50 (blue trend-line) with the previous Bear Cycle bottoming just above the 1M MA100 (green trend-line). The last Cycle Top was priced exactly on the 0.382 Fib and the next 0.618 is on October 2026 based on the expected April 2028 Halving.
So based on this highly effective model, the current 2026 Bear Cycle should bottom this October, which is consistent with the majority of analyses and models we've used. Technically is should test the 1M MA100 as well, so (again consistent with our past analyses) this should be closer to $40000.
Please LIKE 👍, FOLLOW ✅, SHARE 🙌 and COMMENT ✍ if you enjoy this idea!