
Macroeconomic events hit us hard, recent trade review
These past couple of days I couldn't update due to computer repairs, it's been a while. Today is June 19 at 12:17 PM in GMT+8. Our trading progress hasn't been smooth lately, mainly due to unexpected changes on the macro level. The Fed chair made extremely hawkish statements during this period, which directly disrupted our original trading plan, causing a temporary reversal in market logic.
In the original plan, we were setting up trades for Bitcoin (BTC) on the hourly chart. Looking back at the price action, Bitcoin experienced a rapid drop below a key support level, only to quickly reclaim it. From a technical standpoint, this 'break and reclaim' is a classic bullish signal, indicating strong support below. Therefore, we positioned ourselves for a long on WLD (Worldcoin). Based on WLD's performance on the 15-minute EMA filter, it successfully closed above the filter line, and the overall structure maintained a healthy bullish arrangement, fully capable of pushing towards our target.
However, this sudden macro hawkish event ultimately dragged down Bitcoin, and WLD was also pulled down by the strong market. Although this trade ended with a regrettable stop-loss, it's important to emphasize to our VIP partners that the opening logic and technical execution at that time were completely sound given the candlestick patterns. Trading itself is an art of probability; no one can guarantee every trade will win. The key is whether we adhered to the correct system. Currently, the overall bullish momentum of WLD has not been completely exhausted, and it is still not suitable to blindly short at this stage.
Bitcoin Technical Analysis: The Game of Key Bullish and Bearish Critical Points.
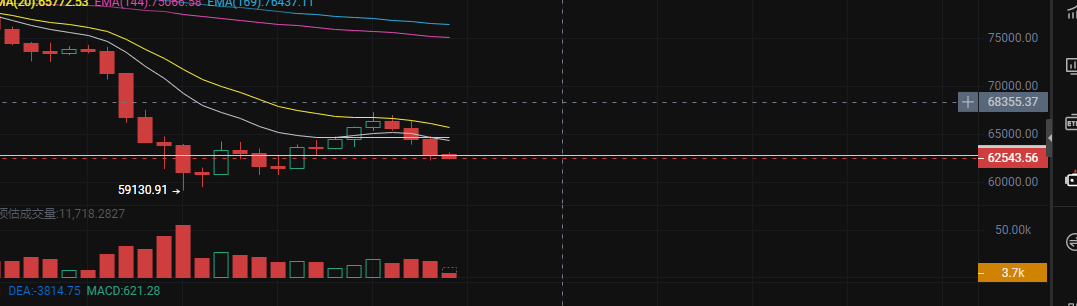
Returning to Bitcoin's daily level, the overall pattern has clearly turned bearish. The previously crucial 'support-resistance' conversion level of $64,200 has been forcefully breached, and yesterday the market closed with a large bearish candle, showing a softening trend with three consecutive days of declines. However, it is worth noting the ventilation detail: although the decline was steep yesterday with a significant bearish candle, the overall trading volume has decreased compared to the previous days. This 'price drop with volume shrinkage' phenomenon indicates that liquidity below the current position is actually quite scarce. If the daily closes with a bottoming doji at this position, even without a strong rebound, it will significantly release the bullish momentum and indicate positive signs of bottoming.
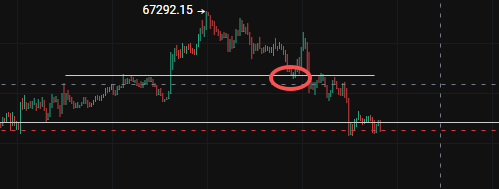
At the 4-hour level, the price is currently completely suppressed below the EMA filter line, which belongs to a standard trend-following bearish management range. Meanwhile, at the hourly level, the market appears particularly subtle. We need to closely monitor the left-side low point structure: the market is currently testing a 'higher low,' and this relative high has not yet been broken by bears, which means the market has not created a 'lower low.' As long as this structure remains intact, bulls still have a glimmer of hope. It is possible that the market may rebound to $67,200 and once again challenge the large gap above.
The night before last, the market briefly showed signs of improvement and recovery, but after a Federal Reserve official's speech in the early morning, the price dropped sharply again. The comforting point is that Bitcoin's performance during this round of hawkish rhetoric has not been as dreadful as gold.
Currently, if the hourly level can fully reclaim and firmly stand above the EMA filter line, there is actually a scalping opportunity in the short term.
Order Book Liquidity Analysis and Bitcoin Trading Strategy.
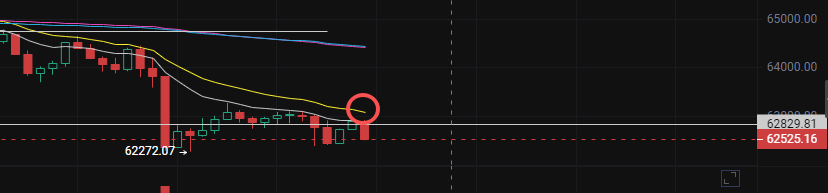
From the order book data, the bullish liquidity below is mainly concentrated around $62,000. A close observation reveals a large buy order that has been placed for 7 days at this price point. In practical operations, we need to keep a close eye on the defense of this large order. If the market can gain effective support here, or if it performs a 'quick spike down and then quickly recovers' act, it will be an excellent left-side long entry opportunity.
Although there was a downward spike in the market, the depth of the spike was not sufficient to completely clear out the liquidity below. Therefore, the ideal scenario is to see the price deeply break below $62,000 and then recover with volume. At this point, we can immediately engage in a scalping-style ultra-short position. Another relatively conservative right-side trading signal would be to wait for the hourly candlestick to firmly stand above the EMA filter line before entering. Our first take-profit target is clearly set near the conversion level of $64,600, and if bulls can further establish an advantage, the large target above can be looked at in the range of $67,000 to $68,000. At that time, the market will return to a wide oscillating structure.
Conversely, if the $62,000 line is eventually breached and cannot be reclaimed, the only defense below will directly test the psychological level of $60,000. However, investors need not panic excessively; the current market lacks a continuously significant external bearish environment, and liquidity is relatively thin. The market is unlikely to experience a series of rare rapid declines and crashes. Given that the sentiment for both shorting and longing is not very enthusiastic at the moment, the core logic for Bitcoin remains unchanged: a large-scale trend reversal has not yet arrived, and the phase of rebound has temporarily ended. It is crucial to avoid blindly chasing shorts and also not to rush into bottom fishing; observe more and act less, and patiently wait for key boundary signals.
Gold Bottom Fishing Timing and Hype Shorting Opportunity Layout.
Now let's look at the gold market. Gold has recently experienced a sustained volume drop, and it appears to have no support on the chart. Many investors, in their panic, are asking whether it’s time to enter for bottom fishing. From a macro long-term perspective, we still hold a firm optimistic stance on gold's value retention and appreciation potential. However, just as we accurately predicted at the beginning of the year, once hawkish Federal Reserve officials come to power and release strong signals, they will undoubtedly engage in a frenzied 'squeeze' and suppression of non-yielding assets like gold to defend the absolute position of the dollar.
For long-term investors, this artificially induced suppression is precisely a rare golden opportunity for bottom fishing. However, one must eat a meal bite by bite; trading should not be rushed. We judge that gold will likely test the support strength at the important threshold of $4,000 again. Therefore, patiently waiting for the market to fall into the $4,000 range, which is a safer ideal zone, before building positions in batches, is the choice with a higher win rate.
Finally, a key reminder about HYPE.
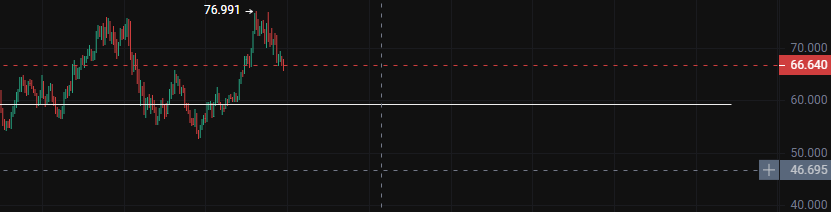
Lastly, a key reminder about the shorting opportunity for HYPE. On the daily level, this token has formed a very significant double top resistance pattern at the high of $76.9, making it a clear and perfect textbook short position. After a period of decline, although the current three continuous daily candles are gradually shortening, indicating a slowdown in the short-term downtrend, this does not change its right-side bearish trend.
In the micro movements of the hourly level, the highs of this token are continuously declining, with each rebound weaker than the last. To avoid falling into the trap of blind trading and lack of calm during consecutive losing periods, I have already initiated a light short position at the price of $71 and promptly shared my thoughts with VIP partners. The upcoming core strategy is very clear—short on the highs. As the manipulator's short-term aggressive price rally officially comes to a close, the fifth wave of the uptrend has already established a termination in the double top. The profit space below this token is extremely broad; if the price can again rebound to the resistance range of $69 to $70 and face resistance, it will be an excellent opportunity for us to add to our short position. Overall, this token is expected to undergo significant retracement in the future.
Again, this token has formed a very significant double top (corrected from the original mislabeling of double bottom in the context of shorting) resistance pattern at the high of $76.9, making it a clear and perfect textbook short position. After a period of decline, although the current three continuous daily candles are gradually shortening, indicating a slowdown in the short-term downtrend, this does not change its right-side bearish trend.
In the micro movements of the hourly level, the highs of this token are continuously declining, with each rebound weaker than the last. To avoid falling into the trap of blind trading and lack of calm during consecutive losing periods, I have already initiated a light short position at the price of $71 and promptly shared my thoughts with VIP partners. The upcoming core strategy is very clear—short on the highs. As the manipulator's short-term aggressive price rally officially comes to a close, the fifth wave of the uptrend has already established a termination in the double top. The profit space below this token is extremely broad; if the price can again rebound to the resistance range of $69 to $70 and face resistance, it will be an excellent opportunity for us to add to our short position. Overall, this token is expected to undergo significant retracement in the future.
❀❀END❀❀