
Macro Trends and Market Sentiment: A Bounce is Just a Bull Trap
The current global macro situation is quite complex. The 'Don' (Trump) has failed to facilitate a timely peace negotiation. Although the Swiss talks set for June have kicked off, tensions in the Middle East have escalated again, with Israel launching a new military operation against Lebanon. Meanwhile, the Don has made a series of tough statements, claiming that if negotiations fail, force will be used to take control of the Strait of Hormuz, and even suggested charging fees to cover America's losses.
Investors are no strangers to politically charged statements like this. The ongoing geopolitical chess game has been largely priced in by market psychology. In this context of mixed bearish signals, Bitcoin showed a bit of 'reverse growth' over the weekend, especially after MicroStrategy announced another Bitcoin buy, triggering a short-term market rebound.
However, the stage-wise adding positions by MicroStrategy cannot fundamentally cure the overall stage bear market at hand. Therefore, the next major directional trading strategy is very clear—Old K’s personal assessment is that all current rebounds in this market are essentially “bull traps” (bait for longs). As market volatility intensifies, investors should not get blindly optimistic from short-term spikes.
Weekly and daily chart analysis: a long trap in a range-bound market
From a technical perspective, first examine Bitcoin’s weekly chart. Last week, the weekly candle closed as a bearish (red) candle, but because this bearish candle did not fully engulf the bullish candle from the previous week, it indicates that the market currently does not have the absolute volume and sustained momentum needed for a continuous, rapid selloff. However, what medium-to-long term participants must be highly alert to is this: the weekly chart has once again formed a dead cross. This means that the overall medium-to-long term signal from the weekly chart is significantly bearish; even if the first half of the week saw a rebound, it is only a localized correction within a downtrend.
Now look at the daily timeframe: it shows a fairly clear range-bound pattern, and because recent swing lows are gradually being raised, the near term is slightly tilted toward bullish sentiment. Currently, the daily chart is continually creating “higher lows” while also showing “higher highs.”
In the future, it’s not out of the question that price will follow this inertia and attempt another push to a higher high. What you need to be clear about is that this potential higher high is very likely to be the last wave of rebound by the current longs (i.e., the “last gasp”). The daily timeframe consolidation is somewhat bullish, but that’s only a carefully crafted trap set by the main force before a further plunge, designed to accumulate more long-side liquidity.
4-hour chart technicals: key support/resistance swap levels and the limit of the rebound
Focusing on the 4-hour candlestick chart, there are two extremely key support/resistance swap lines (levels where support becomes resistance, and vice versa) that need to be highlighted for careful plotting:
The first key area is around $65,000. Previously, longs faced extremely strong resistance here and repeatedly failed to break through. Then, the bulls forced a breakout above $65,000 with a large bullish candle, but unable to effectively hold the level, after a brief consolidation, the price plunged sharply following bearish signals released by the Fed officials’ extremely hawkish policy.
When the price slid down to around $62,000, Old K had clearly advised against blindly chasing shorts. Because the Order Book shows that this level has piled up a huge amount of spot and futures buy orders. At present, the market has gradually digested the near-term negative geopolitical signals, and some floating short positions have started to consistently stop-loss, which in turn drove this upswing rebound by the bulls.
For the near-term outlook, the direction of the 4-hour timeframe depends on whether the key $65,000 area holds or breaks:
·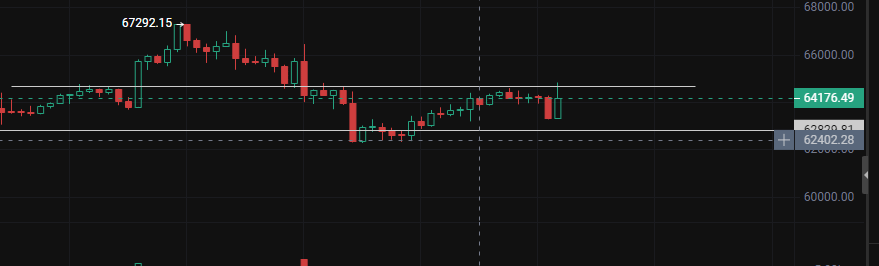
If it can successfully hold above the $65,000 line: a wide-range consolidation would begin, and the price would at least have the momentum to fill the gap and test $66,000. Since this area is also burdened by heavy pressure from the Vegas Channel, the market will definitely face resistance here. If the bulls continue to push higher, their upper limit target is roughly around $68,000, with the intent of piercing the above-side shorts’ liquidity.
If it fails to hold above the $65,000 line: the narrow-range consolidation will continue, the market will keep moving weakly downward, and the price will once again pull back to retest and test the support strength at $62,000.
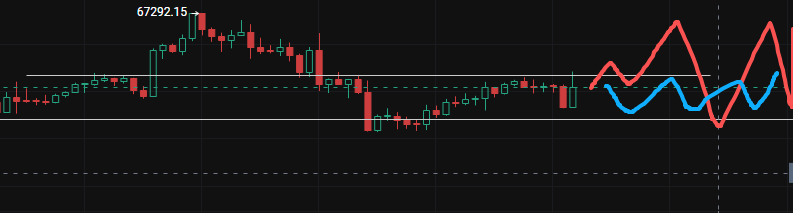
In the short term, the probability of the market directly breaking below $62,000 is relatively low, because there is a lack of more disruptive major bearish catalysts. The market is basically choosing between narrow-range consolidation and wide-range consolidation to burn off positioning patience. And on the smaller 1-hour timeframe, the price moves up and down, with frequent needle-like wicks, lacking coherence—making it easy to get hit from both directions, and not suitable for opening positions blindly.
Positioning / distribution and the long-short game: retail bullishness and the main force’s “bull trap” scenario
Based on on-chain data and market sentiment, the current crypto market is still in a vacuum phase of severe liquidity shortage. You can clearly see a dangerous signal from the long/short positioning ratio: retail investors remain blindly bullish and occupy an extremely high proportion of longs; in contrast, large players and institutional main forces generally hold a bearish or neutral stance.
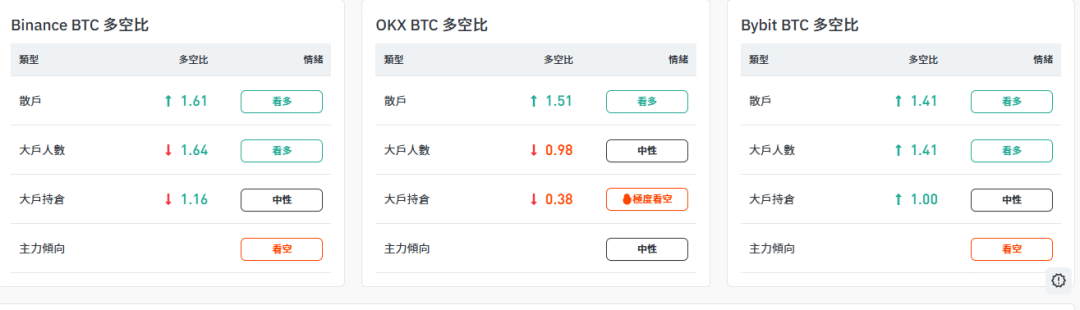
Under these conditions of low liquidity and retail investors piling into bullish bets, the market often needs to rehearse a specific “bull trap / chase-up” scenario: because the total number of long retail investors and their capital are still not enough to support the launch of a bull run, the market must manufacture a localized rebound to attract more sidelined retail investors to enter as bag-holders, while also pressuring some floating short positions to cut losses and surrender.
Only after the market accumulates a sufficient scale of long-side liquidity during the rebound (i.e., retail has fully absorbed it) will the main force launch a fast and violent downward crash. Even with positive stimuli from micro-strategy adding positions, or a short-term push from unexpected favorable policies, it will most likely still turn into a more intense and continuous selloff after the move is capped. Given this, shorting into strength remains the only core strategy that follows the current mainstream long-term trend. Even if the price rallies back up to $65,000 again, Old K personally has no interest in going long.
Bear-market response strategy based on periodicity: anchor the realization price and wait for the DCA zone
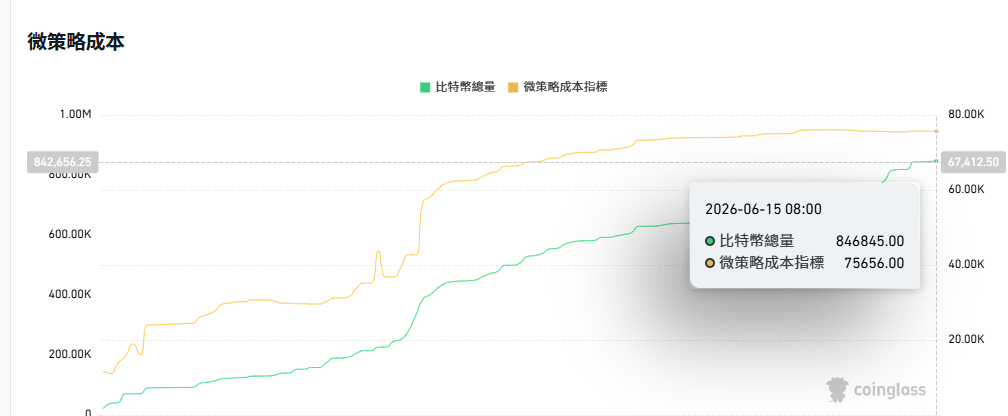
With institutions continuously adding positions, many investors have started to feel anxious and even question whether a deep pullback to $53,000 can still be realized. We need to view the institutional actions of the micro-strategy rationally. Data shows that MicroStrategy’s current average Bitcoin holding cost is as high as $75,000. This means that the institution’s buying price does not directly guide ordinary retail investors in searching for the “absolute market bottom.” The core role of institutions adding positions is to boost overall market confidence and prevent Bitcoin from suffering a chain-collapse, rather than to establish a confirmed interim low.
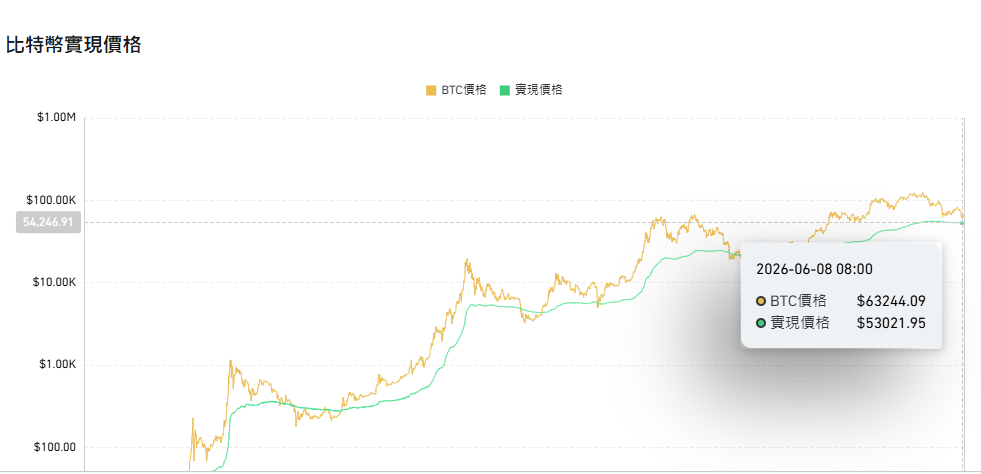
Retail investors still need to maintain great patience and wait for the ideal price for DCA and the dip-buying range. Looking back at Bitcoin’s historical cycle data, Bitcoin’s “realized price” is currently around $53,000. In every previous bear market cycle, price eventually falls below the realized price. While history won’t repeat itself in a simple mechanical way, and this bear market may evolve differently, testing or coming endlessly close to $53,000 remains a high-probability event.
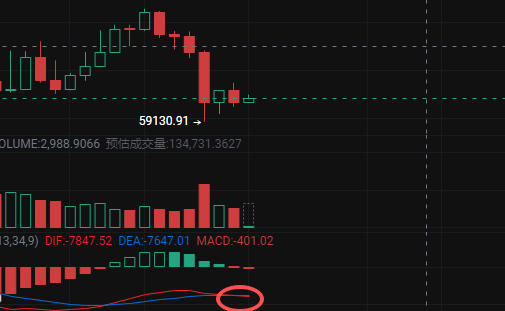
Of course, this does not mean investors have to wait until $53,000 to buy. The right-side trading logic proposed by Old K is: once the price pulls back below $59,000, it can be considered that you have officially entered the golden zone for staged dip-buying or dollar-cost averaging. In a market lacking a clear catalyst for a sudden surge, keeping a light position or even staying in cash, and patiently waiting for the best “strike zone” amid sideways grind-downs, is the evergreen way in a bear market. When there is no clear opportunity, patience is the best trade.