
Macroeconomic Situation and Geopolitics: US-Iran Negotiations Trigger Global Asset Volatility
In the current complex macro background, global financial markets are experiencing intense fluctuations. On the geopolitical front, the situation surrounding Trump has yet to fully settle, and negotiations still face numerous challenges; at the same time, Middle Eastern trade talks are intensively releasing hints, exacerbating market cautiousness.
On the macroeconomic level, the latest developments in the US-Iran negotiations have directly triggered intense volatility in the commodity markets. Yesterday morning, there were reports of a pause in the US-Iran talks, which sent international crude oil prices soaring, briefly hitting a high of $80 per barrel. However, shortly after, senior officials from both sides provided crucial clarifications on the negotiations, indicating that a foundational agreement had been largely reached, and the US would temporarily ease sanctions on Iranian oil. Thus, the first round of talks has officially concluded, and the next 60 days will be left to technical experts for discussions. Although this process still carries risks of a failed roadmap, the 'biggest short-term bearish sentiment' in geopolitics has been temporarily alleviated, with both parties showing a strong willingness to avoid conflict. The US aims to pave the way for mid-term political elections, while Iran is eager to stabilize itself by ending disputes.

With negotiations continuing to be expected, crude oil surged first, then quickly plunged and fell back. In the future, it will most likely keep a sideways-to-downward rangebound trend. Crude oil’s pressured downside directly led to a temporary failure of risk-hedging assets, easing pressure on U.S. Treasury yields and interest rates—thereby providing momentum for a rebound in U.S. equities.
 This wave of gains in U.S. stocks is also the key external driving force coming from yesterday’s crypto market—especially Bitcoin’s rebound against the trend.
Bitcoin order-book analysis: liquidity grabbing behind the false breakout and the long trap
From Bitcoin’s (BTC) internal structure and order-book data, the overall market is still in a state of extreme liquidity scarcity. Yesterday, after the market went through early suppression and consolidation, Bitcoin first formed an illusion on the trading screen of a “slight bear trap with a long failure to break,” luring some inexperienced retail traders into shorting. Then, the consolidation did not evolve into a continuation-to-down structure; instead, it triggered a rapid series of upward breakouts.
However, the subsequent price action proves that this was only a textbook-level false breakout. After the downtrend line and horizontal trend line on the chart were broken upward one after another, the price failed to hold and quickly dropped back inside the range. This “double kill” move from both sides fully confirms that the market will most likely enter a wide-range consolidation pattern next.
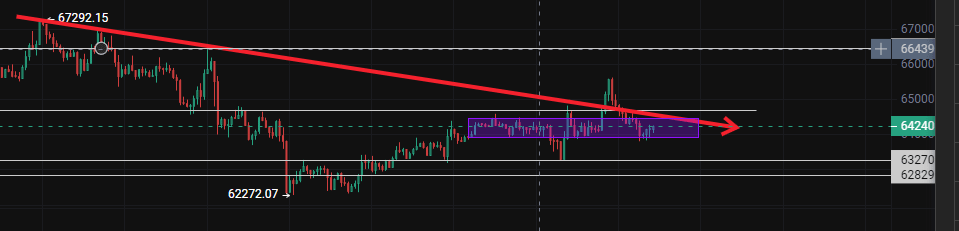
A series of trading maneuvers by the main force/market maker essentially amounts to executing a long-planned “long-setup play.” Because the $65,000 to $66,000 range contains a very large amount of long liquidity, the market maker used macro positive news to propel the price upward, precisely siphoning off that liquidity and triggering short liquidations/stop-losses. The ultimate goal is to accumulate retail long positions by manufacturing the illusion of a return to a bull market, thereby building the downward momentum to further slam the price into lower ranges (such as the $53,000 area) in the future.
Core trading view: multiple supports offset each other; the timing for a 5,000-point plunge is not yet here
The market is broadly concerned about one question: will Bitcoin immediately experience a rapid, 5,000-point-scale plunge, quickly dropping back to $59,000? Through deep analysis, it is very unlikely that such a one-shot, fully delivered 5,000-point crash will happen in the short term. The market is more likely to use time to make up for space and continue a consolidation pattern.
The reason for making this judgment is mainly that multiple sources of long support and positive factors are offsetting the downward pressure:
·
Downside-resistance in the technical structure: although the daily-level rebound currently shows signs of weakening momentum (“momentum fading”), the trading volume cannot compare with the earlier phase of the sharp selloff. This results in a lack of动力 for a full reversal and big upside rally in the short term. However, this low-volume consolidation also means downward momentum needs to rebuild its strength.
Release of macro negative factors: the U.S.-Iran negotiations have moved into technical consultations. The biggest geo-conflict risk has already been partially eased in stages, and overall macro sentiment is leaning toward mild positives.
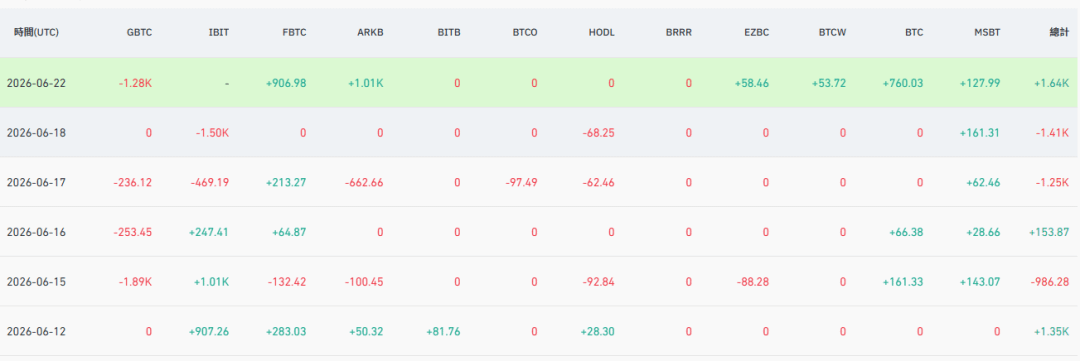
Ongoing buy orders from spot ETFs: yesterday’s Bitcoin spot ETF overall showed net inflows. Although IBIT’s specific data has not been fully disclosed yet, based on its stock price performance and related trends, it can be confirmed that institutions and large funds’ willingness to buy Bitcoin at low levels remains strong. This genuine buying at low prices builds a solid defensive cushion for the price, meaning a major crash is not likely to arrive immediately.
· 
Multi-dimensional data indicator perspective: retail FOMO versus the market maker’s squeeze-forcing shorts battle
From a micro perspective of derivatives and on-chain data, the long-versus-short battle has entered an intensely heated phase. At present, the long/short ratio still shows the market overall leaning bearish over the coming week. The core reason is that retail traders continue to blindly go long during rebounds, causing the market to quietly accumulate froth and FOMO (fear of missing out) sentiment. Changes in the funding rate also confirm this: the rate has gradually shifted from occasional negative values or relatively low positive values over the weekend to more clearly positive values, which means long leverage is accelerating its buying.
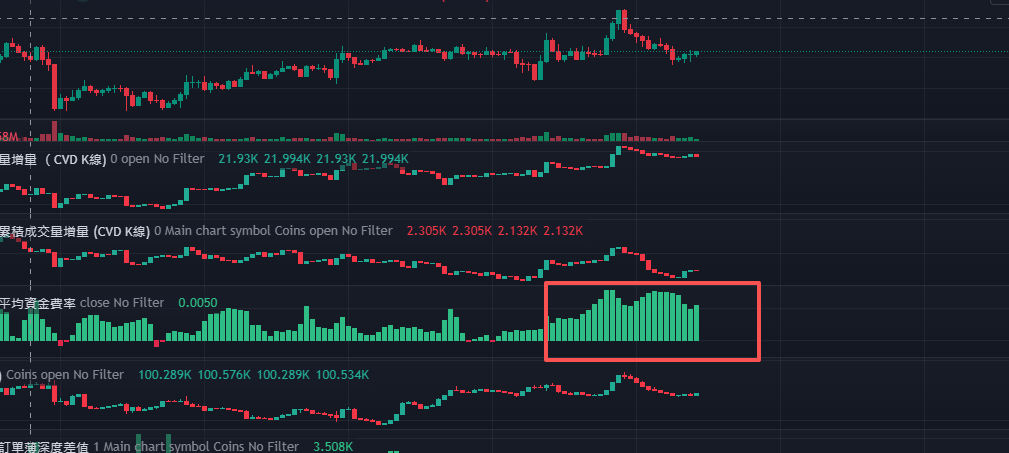
Combining CVD (cumulative spot volume price delta) and open interest, yesterday when price rose rapidly, open interest also surged in sync, successfully wiping out a large number of short positions. In this rally, there was not only profit-taking from long trades, but also an abundance of short liquidations and stop-losses. However, what is worth being cautious about is that when price just pulled back to the support area, CVD rose again quickly, and open interest started climbing once more. Retail long options and spot buying surged again.
From the seat-holder/market maker logic, the market maker believes retail’s long fuel has not accumulated enough, while the shorts have also not been cleared thoroughly enough. Therefore, the main force will not choose an immediate crash; it needs to keep maintaining consolidation, and it’s not out of the question that it may further “squeeze” shorts upward and “bait” longs, in order to completely drain short positions and attract more long buyers to take the other side. A truly big crash still requires a longer period of brewing.
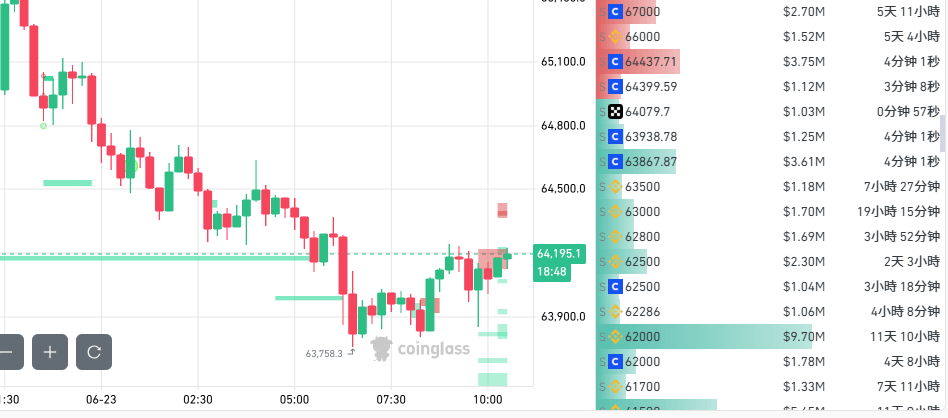
Bitcoin’s key trading levels: closely watch the $63,000 long/short dividing line
At present, the distribution of large orders on exchanges is relatively thin, and the order prices are also far from the current market price. Strong sell orders are concentrated around $67,000, while the key large buy orders are anchored around $62,000. This order placement structure differs significantly from the earlier period, but it also lines up well with the upper and lower boundary zones of the current hour-level price action range.
Back at the daily level, after the transition between yin and yang candlesticks, yesterday the market closed with a candlestick featuring a long upper wick. Technically, this is clearly not a favorable combination for longs; it signals that the overall outlook remains under pressure and that the probability of continued consolidation and downward movement is higher.
On the hour-level micro trading screen, execution should focus on the following key levels and their evolution logic:
Long/short dividing line ($63,000): this is an extremely critical psychological and technical support at the bottom of the current range, with large buy orders below serving as the support foundation.
Downside path: if the future price fails to find support and breaks below $63,000, the next acceleration target for the downside will be directly set at $62,000. This level is also the core zone where earlier short positions took partial profits in stages.
Upside path: if the price can step back onto solid ground near $63,000 and form effective support, the market will not rule out testing $66,000 again to the upside. Notably, on the 4-hour chart, the EMA moving averages (exponential moving averages) and the horizontal resistance line form a perfect overlapping suppression here, creating a short-term ceiling for the bulls.
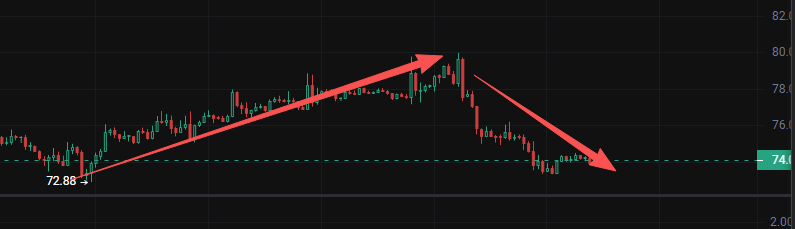
Solana (SOL) special analysis: daily chart double-top worries weigh down the price; waiting for a good long-term DCA entry opportunity
Regarding the trend of the popular altcoin Solana (SOL), its daily chart currently shows a persistent fatigue pattern of repeated topping. Against the backdrop of overall market liquidity being scarce, SOL’s order-book behavior has clearly shifted into a bearish-leaning phase.
From chart patterns, SOL previously attempted to build a “cup handle” structure, but ultimately failed to break out due to insufficient long-side momentum. At present, its daily chart is evolving into a potential double-top pattern. Not long ago, the market strongly went long on SOL by hyping the Meme concept and the AI sector; this in essence was also a perfect long-setup executed by the main force. Therefore, traders are strongly advised not to chase higher blindly and go long SOL at this point.
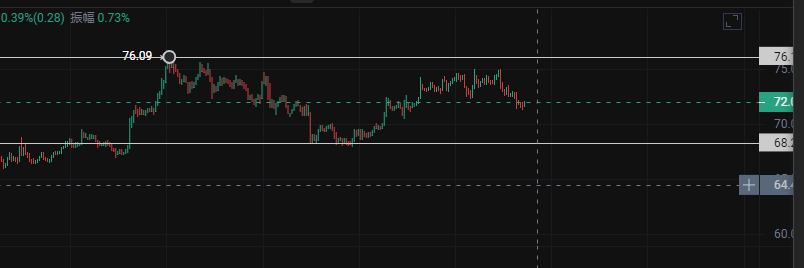
In the hour-level micro price action, SOL has formed a short-term double-bottom support around $70.5, showing some resistance to falling. However, multiple resistances overhead make it extremely difficult to achieve a substantial upside breakout. Going forward, the trading logic should be observed in tandem with Bitcoin: once Bitcoin loses the $63,000 level, SOL’s $70.5 support will be effectively nullified and the price will move directly downward to test the neckline of the daily-chart double-top pattern—$68. If $68 is further broken, SOL will face a deep breakdown and selloff; if it can barely hold, then it will move in sync with the broader market into a wide-range consolidation.
Investment strategy reinforcement: Although SOL is still in a relatively low-price zone compared with its historical high around $200, and is expected to target $300 in the next bull-cycle run, the left-side risks remain fairly large in the short term. This is absolutely not the time for going all-in long on a short-term basis. For firm long-term believers, it’s recommended to give up aggressive short-term speculation and strictly accumulate positions through staged DCA entries within suitable price ranges. For details on the specific DCA price ranges and pacing control, feel free to join the community for a deeper strategy discussion.