There has been some confusion lately on whether Bitcoin (BTCUSD) is still on a Bear Cycle or not. Some still go as far as claiming that the market never entered a Bear Cycle and that based on some custom Liquidity Cycles that the -50% October - February crash has just been a 'normal' correction within a wider Bull Cycle. That is why today we decided to go back to the basics.
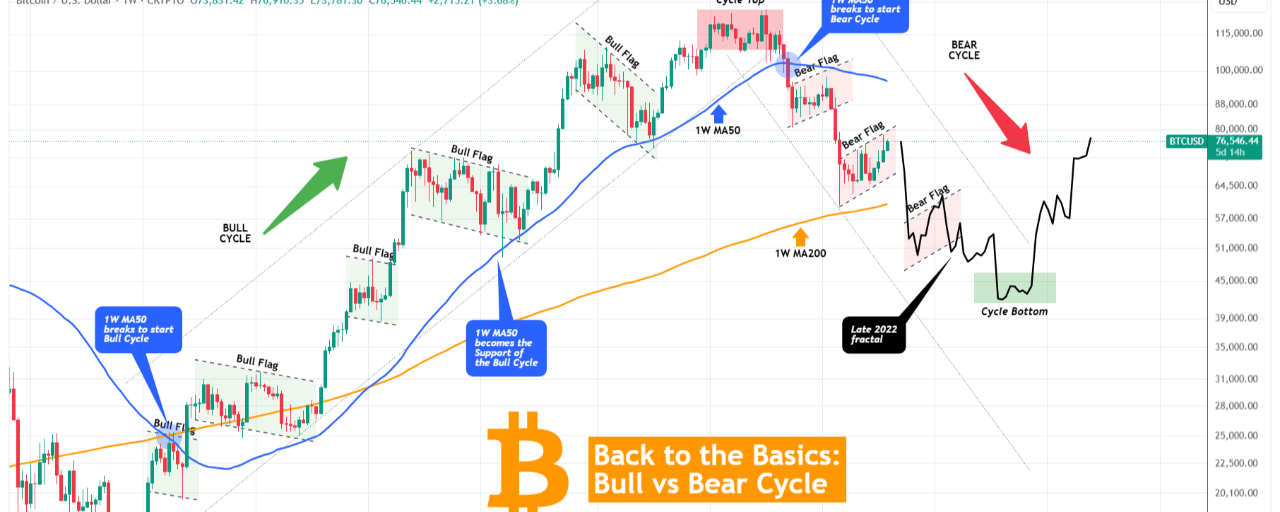
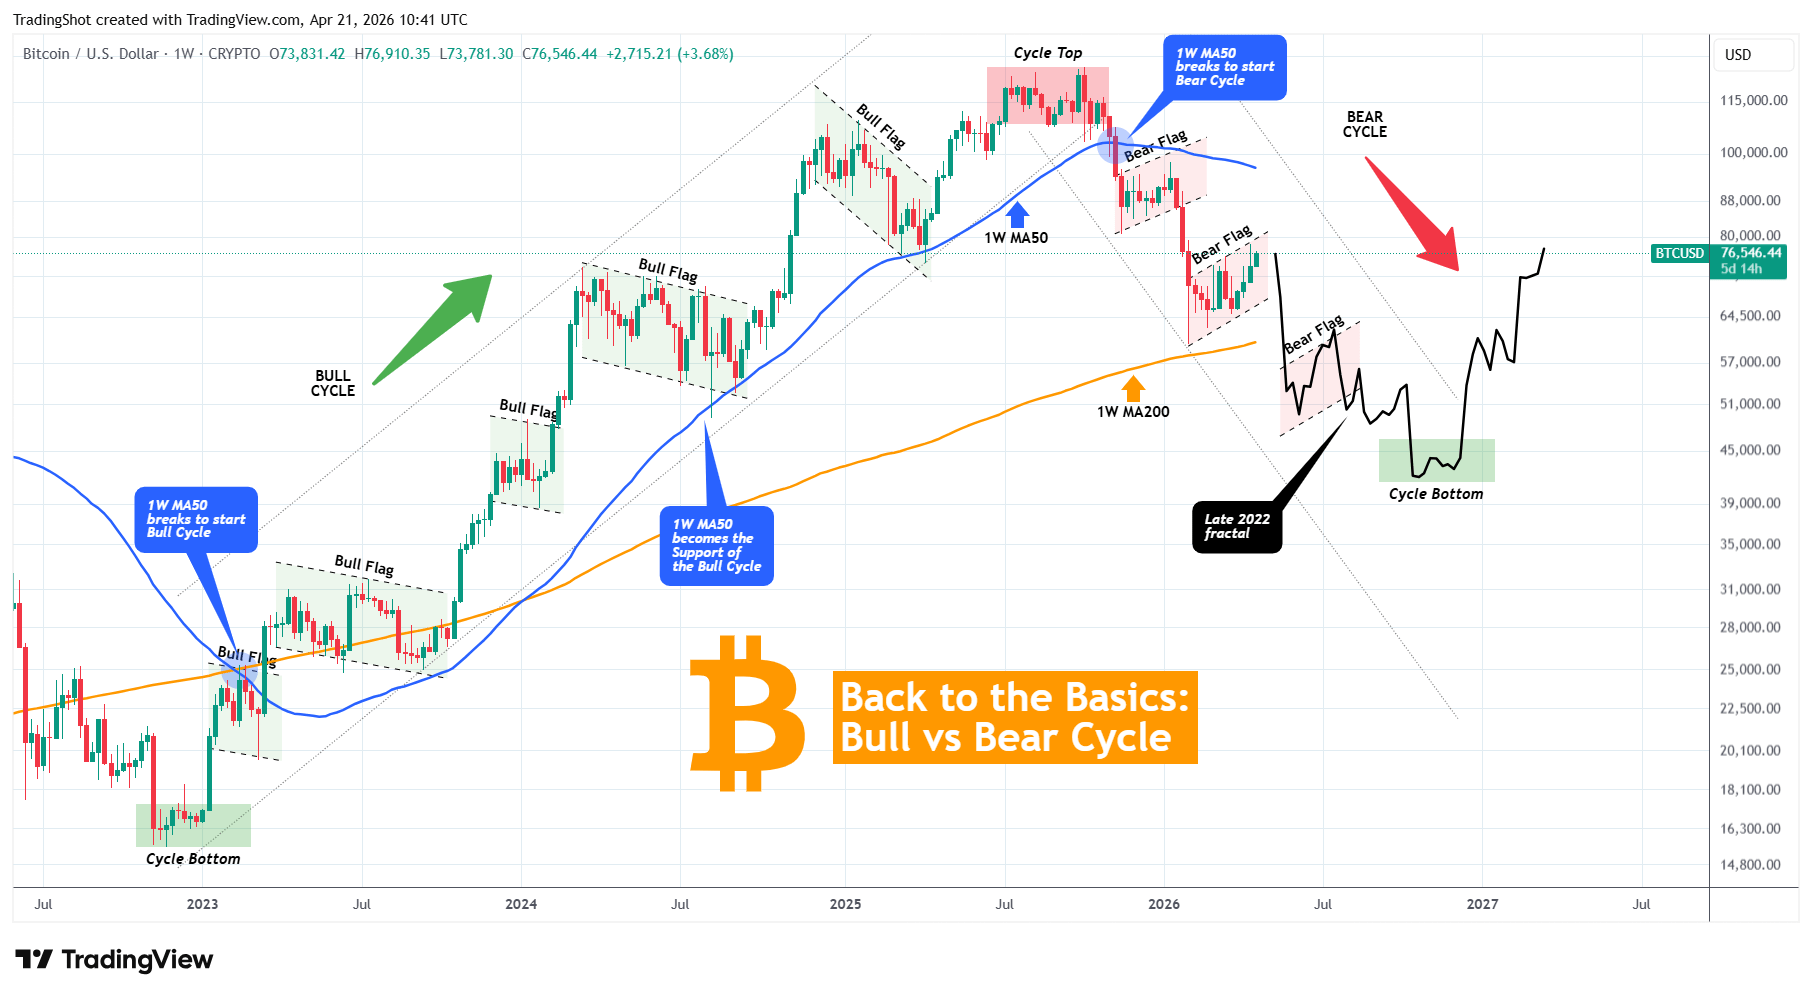
On the left side of the chart you see a clear Bull Cycle. Starting on a Bear Cycle bottom with the price confirming the Bull Cycle by breaking and closing above its 1W MA50 (blue trend-line), which up until that point has been the Bear Cycle's Resistance. What follows is a clear long-term uptrend with a streak of Bull Flags supported by the 1W MA50 until the eventual Bull Cycle Top.
On the right side of the chart you see a clear Bear Cycle. Starting on that exact Bull Cycle Top with the price confirming the Bear Cycle by breaking and closing below the 1W MA50, which up until that point (as mentioned) has been the Bull Cycle's Support. What followed up until today is a 6-month downtrend with so far two Bear Flags suppressed below the 1W MA50. The next Support in line is the 1W MA200 (orange trend-line).
And that's the structural difference between a Bull and a Bear Cycle. Same only inverse. So what BTC is currently at is a Bear Flag that is gearing up for the new Leg downwards. For reference we have taken the post June 2022 fractal (black trend-line) and added it as price action on the current Bear Cycle to see a projection of how it may unfold on a potential October 2026 bottom according to the 4-year Cycle Theory.
So that's it. Nothing more. If that helps a little clearing up the (understandable) confusion, I'd appreciate you telling us.
Please LIKE 👍, FOLLOW ✅, SHARE 🙌 and COMMENT ✍ if you enjoy this idea!