

📊 On May 12th, we cleared our positions above $82,000, warning about risks all the way. Now that BTC has dropped to around $62,000, we're starting to scale in.

🎯 Took profits at higher levels.
🎯 Re-establishing positions at lower levels.
🎯 Successfully executed a nice swing trade.
Brothers who followed the posts and kept up with the rhythm should all be cashing in this round. 🚀

🚨 I have to say, it's a double-edged sword with micro strategies. As the driving force of this bull market, once selling begins, the chain reaction exceeds expectations, and major institutions start to unload. No matter how strong the support looks, it can't withstand continuous selling pressure.
📉 Downward trend! Downward trend!
After piercing through the key support near 66000, it accelerated downwards, directly reaching close to the previous low, eventually stabilizing after a massive spike at 61383.
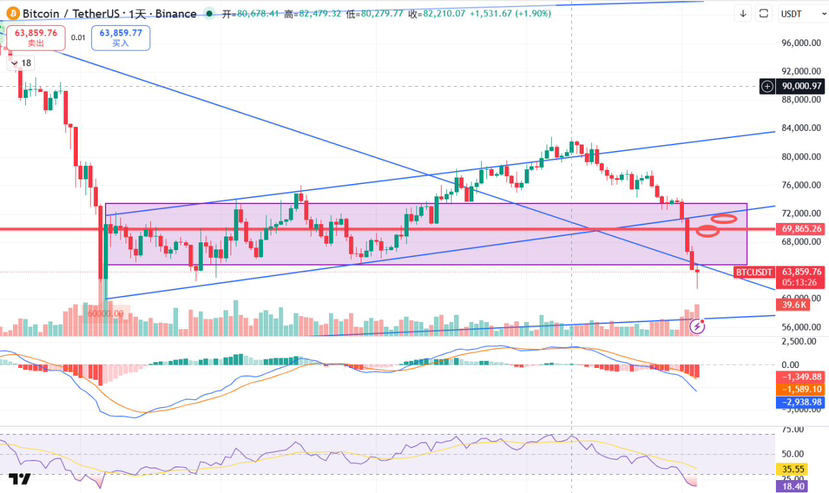
📊 Let's take a look at the rhythm over the past few days. Bitcoin has dropped from 73600, losing about 12000 in less than four days, which is pretty much a landslide. Currently, we are seeing massive volume. Not only has the daily RSI hit historical lows, but even the monthly RSI has reached the lowest level since 2017, suggesting a potential one-shot scenario.
Of course, when I say 'one-shot', I'm referring to this wave of selling. The price action hasn't shown a downtrend with volatility; if it does, a quick acceleration near 60k could directly break the previous low and push down to around 57000. This current movement has tested the strength of the support near the previous low, creating a chance for a rebound. 📈
⚠️ However, the trendline at 66000 has ultimately been broken in a brutal manner, so we can basically conclude that 60000 is not a bottom. After this rebound, Bitcoin will still inevitably head towards new lows, moving towards 57000, which we've mentioned multiple times, and towards the hoped-for bear market bottom of 54000.
In extreme cases, combining with a black swan event (like a massive sell-off from MicroStrategy, or a crash in the US stock market), we might even see Bitcoin start with a 4. Of course, long-term targets are just speculative predictions; we should take it step by step and focus on the current market conditions we can grasp. 🎯
📍 Let's talk about our current operations. After the spike to 61300, both the liquidation volume and trading volume have been massive. Today's price action shows that the one-hour MACD, with both the histogram and the fast/slow lines, has already shown bullish divergence. Overall, the probability of continuing the rebound is quite high.
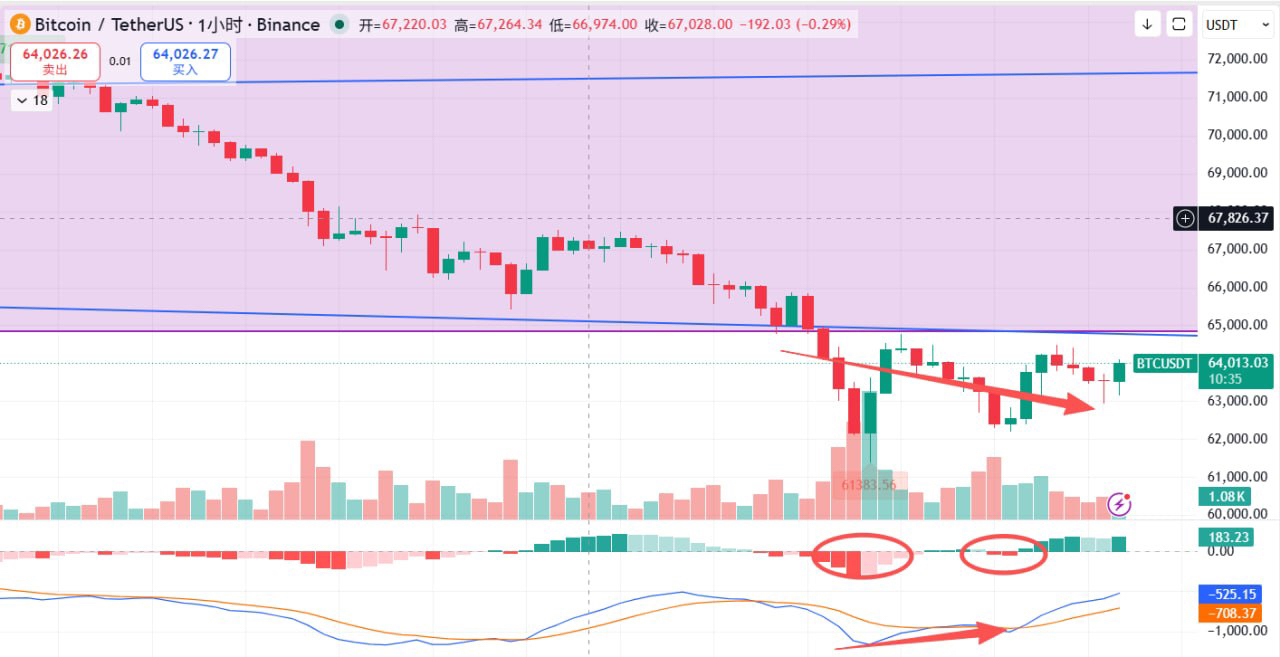
🎯 First minor resistance level: around 65000 (current breakdown level of the channel bottom)
🎯 Strong resistance level: around 69000 (mid-range parallel resistance within the channel)
🎯 Ideal rebound level: around 71700 (bottom edge of the flag pattern)
💡 So there's no need for everyone to panic too much. Just wait for this rebound to play out, then decide on your entry and exit strategies! 🚀📈