The recent market activity surrounding XRP is attracting the attention of analysts following a technical update shared by cryptocurrency analyst Maxi. The analyst's assessment focuses on a visible change in the price structure of XRP after a long corrective phase.
Based on graphic signals, the analyst suggests a possible transition from consolidation to a continuation phase of upward movement. The attached chart, based on the XRP/USDT pair in the 12-hour period, highlights the main trend lines that have guided price movement in recent months.
For a long period, XRP traded within a descending channel defined by a series of lower highs and controlled pullbacks. This structure reflected sustained selling pressure and limited upward momentum. According to the chart shared by Maxi, this structure has now been challenged, with the price moving decisively towards the upper limit of the channel and beginning to break it.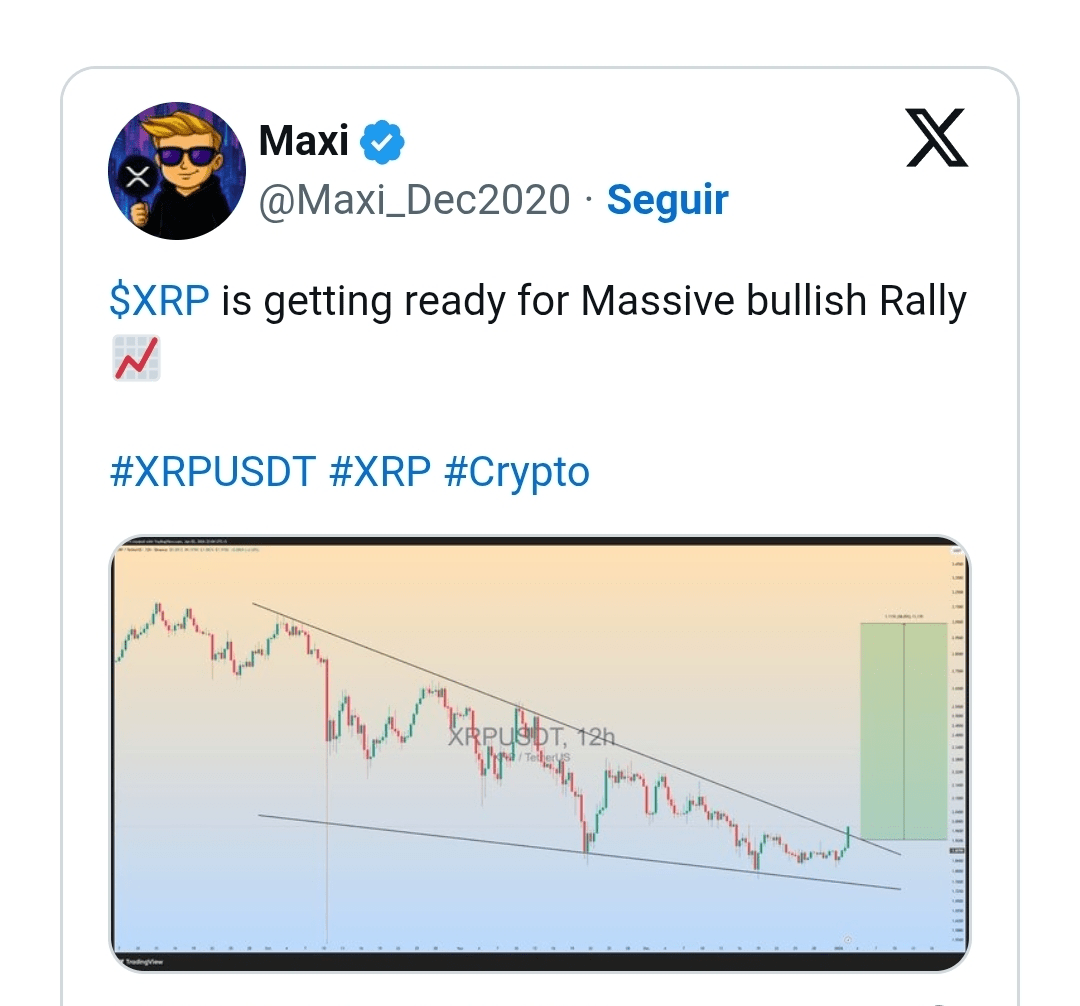
Breakout from a long downtrend
The most prominent feature of the chart is a descending resistance line that has repeatedly limited XRP's advances since the end of 2024. Maxi's analysis suggests a recent bullish candle that breaks this resistance, signaling a possible invalidation of the previous downtrend.
At the same time, XRP seems to be holding above a gently rising support line, suggesting an improvement in market balance rather than a transient price peak.
The projection on the chart indicates a possible upward expansion towards the region slightly above the $3.00 level. This projection is not presented as a guaranteed outcome but rather as an estimated technical target based on the height of the channel and the breakout area. The structure indicates that if the price remains above the former resistance, market participants may begin to reassess the short-term appreciation range of XRP.
Momentum Context and Market Conditions
Maxi's perspective is embedded in broader momentum considerations. The chart reflects higher lows near the lower limit of the channel before the breakout attempt, a pattern often associated with seller exhaustion. The recent expansion in the size of bullish candles further reinforces the view that buying pressure is beginning to outweigh distribution, at least in the observed timeframe.
Although the analysis is primarily technical, it aligns with a period when XRP remained one of the most traded digital assets, benefiting from high liquidity and consistent market participation. These conditions can amplify the impact of structural breakouts when they occur.
Supporting factors beyond the chart
In addition to the immediate technical setup, XRP positions itself as a digital asset focused on settlement, with established infrastructure and a constantly developing ecosystem. Market participants often take this into account when reacting to technical signals, especially when the price emerges from long periods of consolidation.
In this context, Maxi's assessment presents XRP entering a phase where technical structure and market conditions begin to align. The realization of the projected movement will depend on the sustainability of this trend and the overall stability of the market. However, the chart highlights a shift that traders and analysts are likely to closely monitor in the upcoming sessions.

🚀 FOLLOW for early alerts 🙌🏽🚀💰💰💰
Remember folks, that nothing said here represents a recommendation to buy, sell, or maintain assets.
Thank you all!