
This week, Glassnode released an analysis report with a core judgment that can be summed up in one sentence:
This recovery is real, but fragile.
To put it simply:
First checkpoint: 81,000
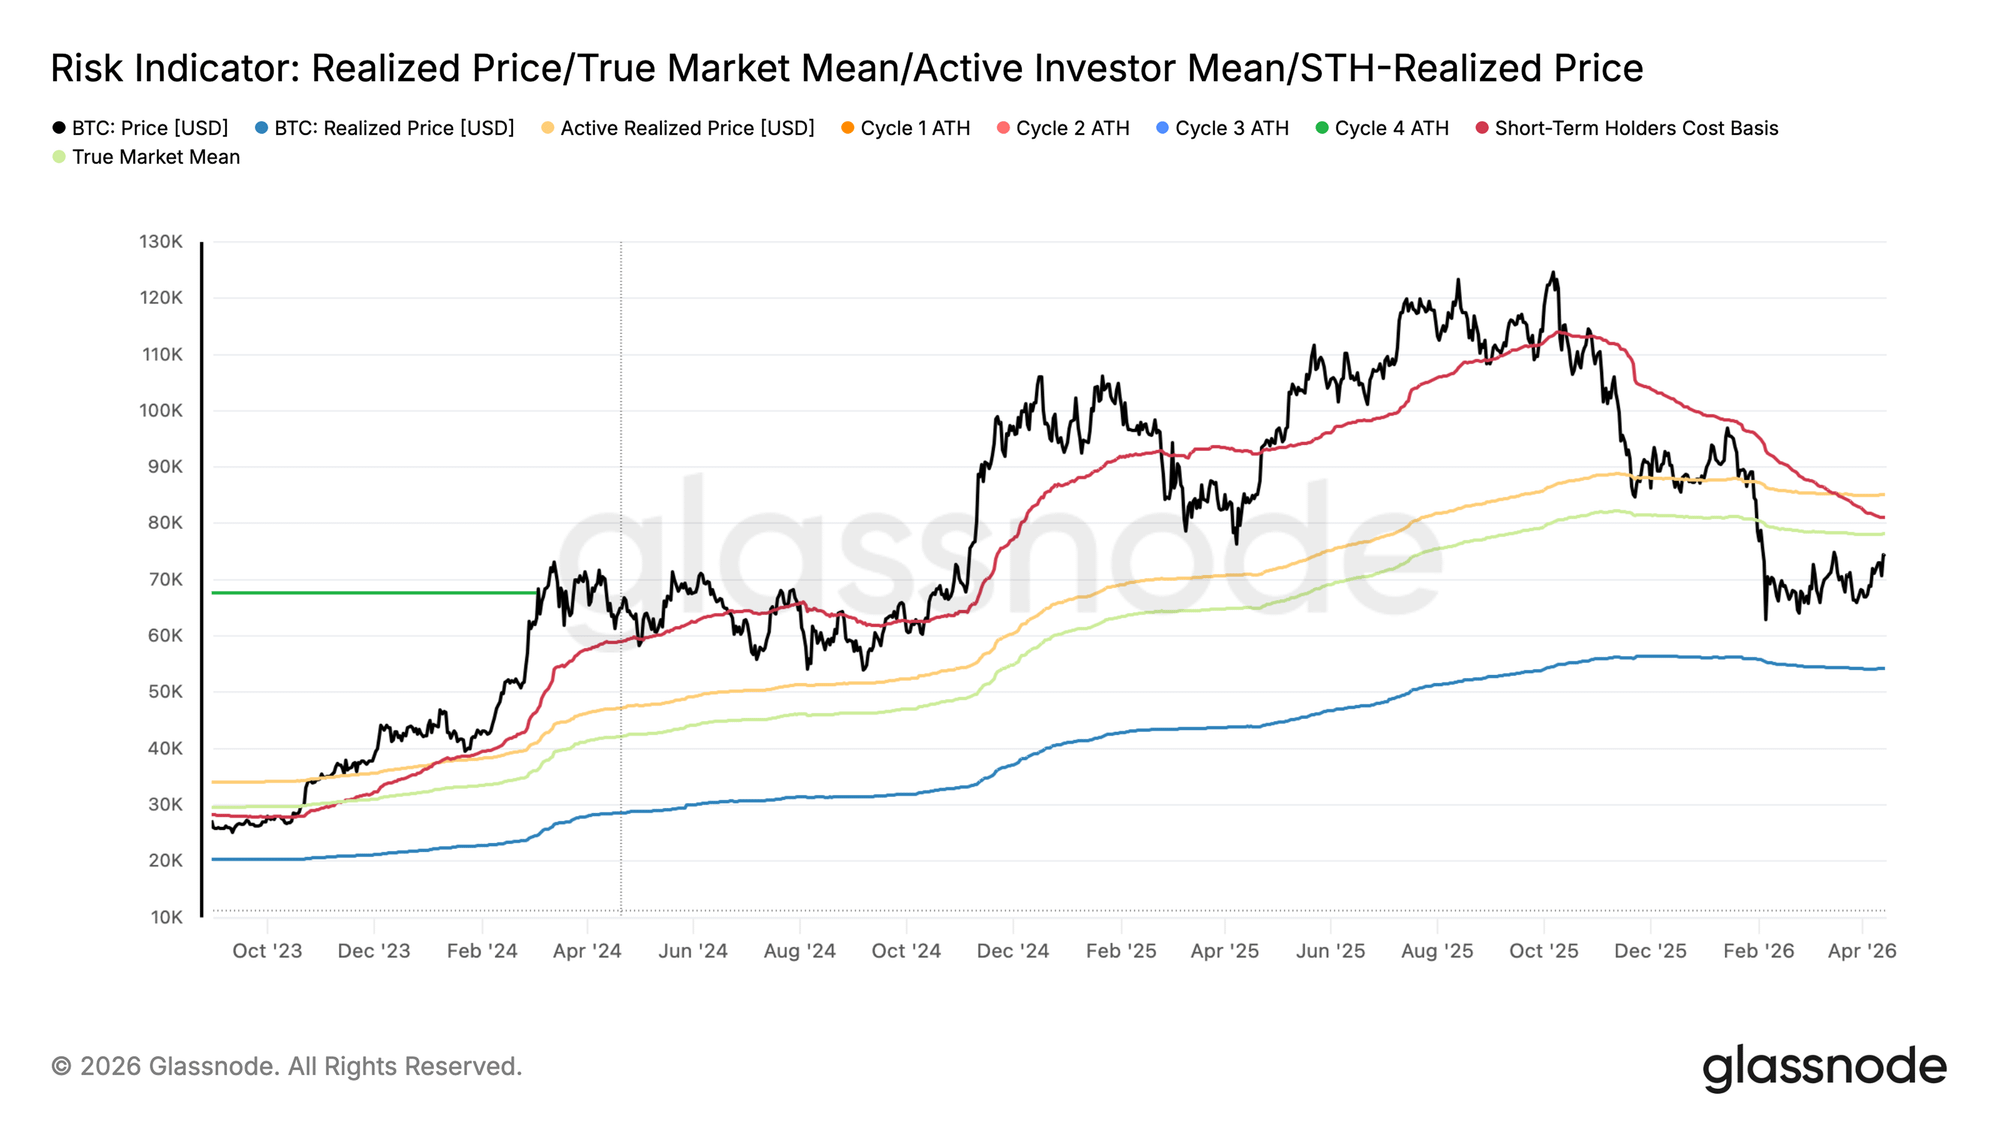
BTC is currently around 74,000, which is still 5.2% away from the 'real market average' of 81,000 above.
This price isn't just a randomly drawn line.
It is the average cost basis of all active supply, the 'cost averaging price' for the entire market.
Historically, bear market rebounds often encounter the first wave of intense selling pressure here—
Because those who were trapped above start to flee as they see their breakeven point approaching.
📊 [Image 1] Risk Indicator - Real Market Mean Structure Chart
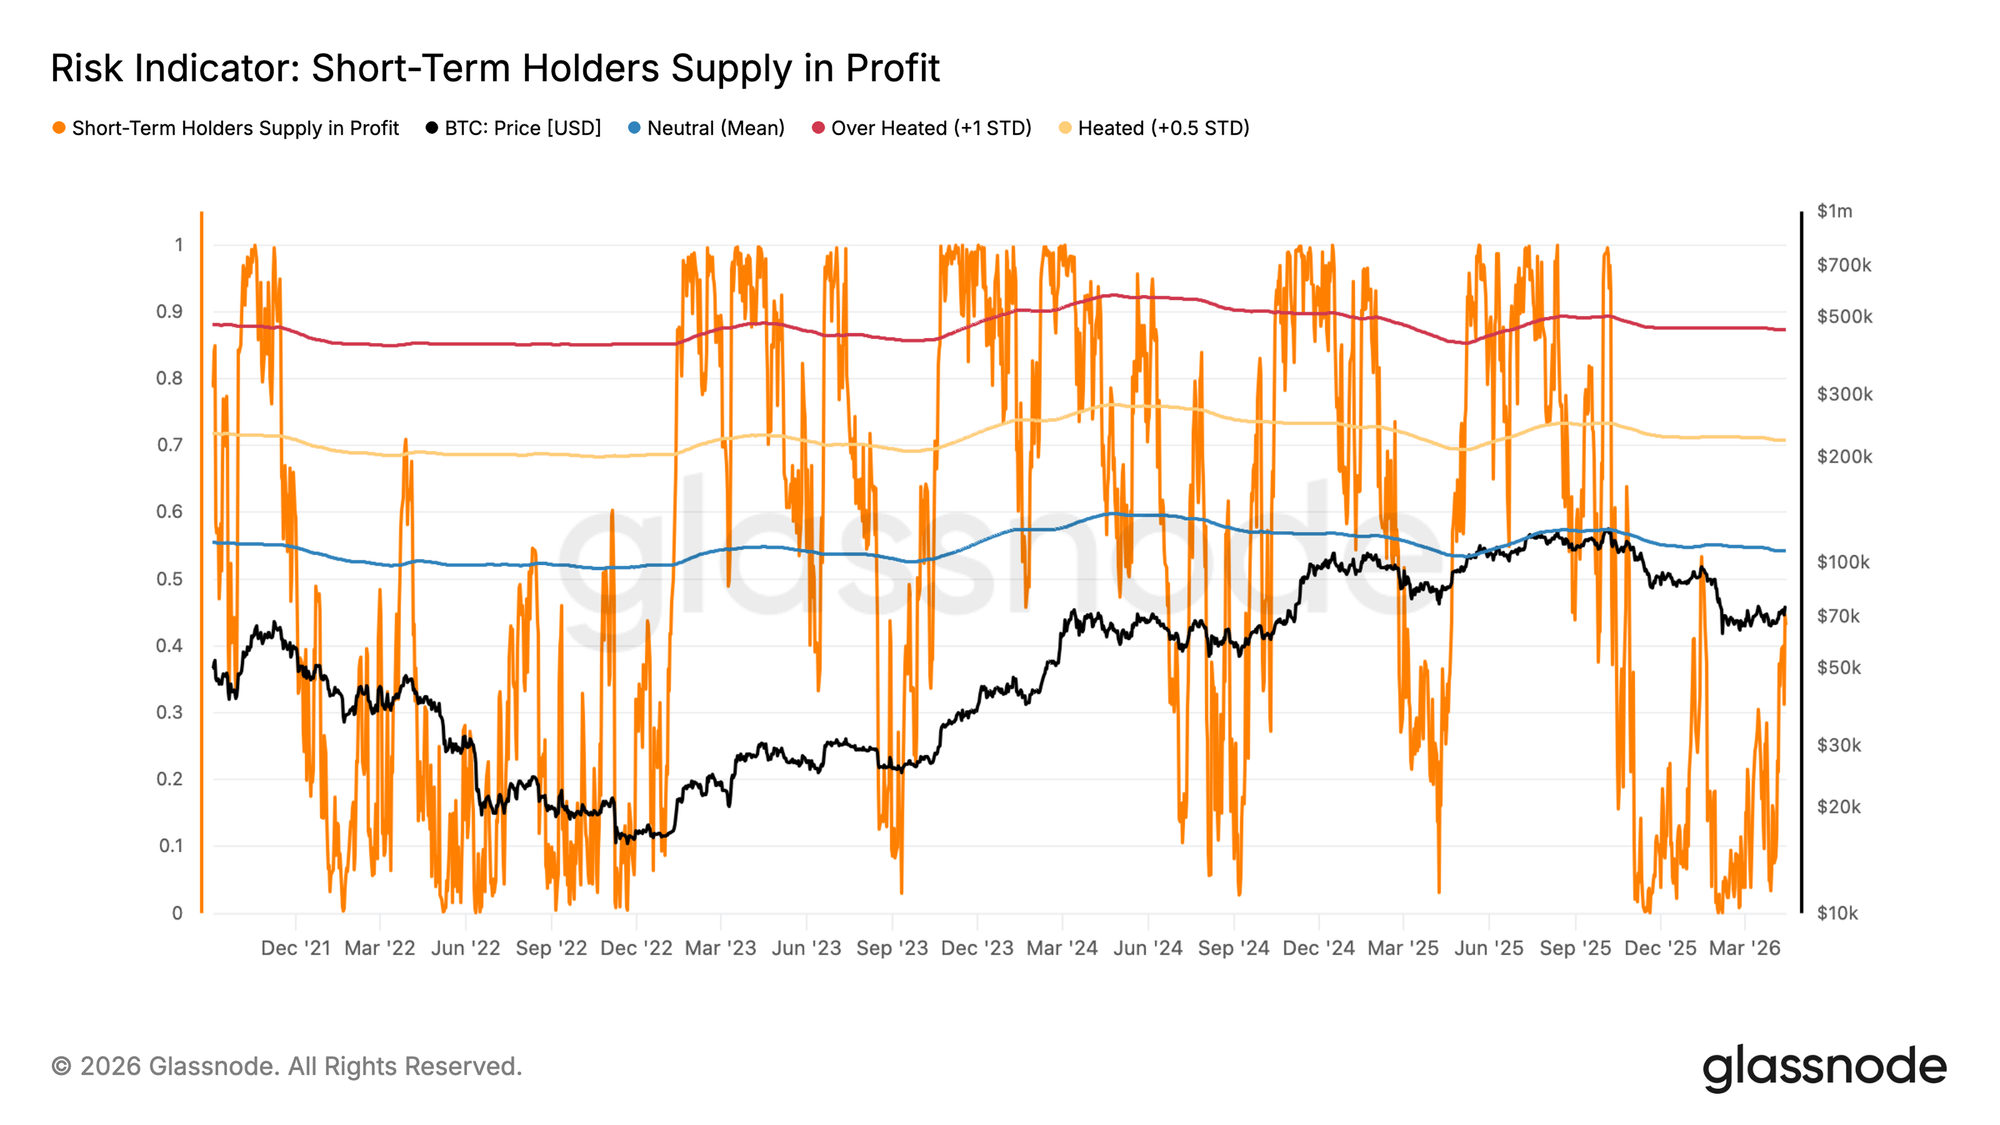
The second signal: Short-term holders have not yet reached the threshold for selling.
The current "profit supply ratio of short-term holders" is 43.2%, while the historical threshold for triggering significant distribution is 54.2%.
There's still an 11-percentage-point gap – this is the objective basis for the fact that there's still room for growth.
However, it should be noted that the closer to this line, the heavier the selling pressure will be.
📊 [Image 2] STH Profitability Supply Ratio · Risk Indicators
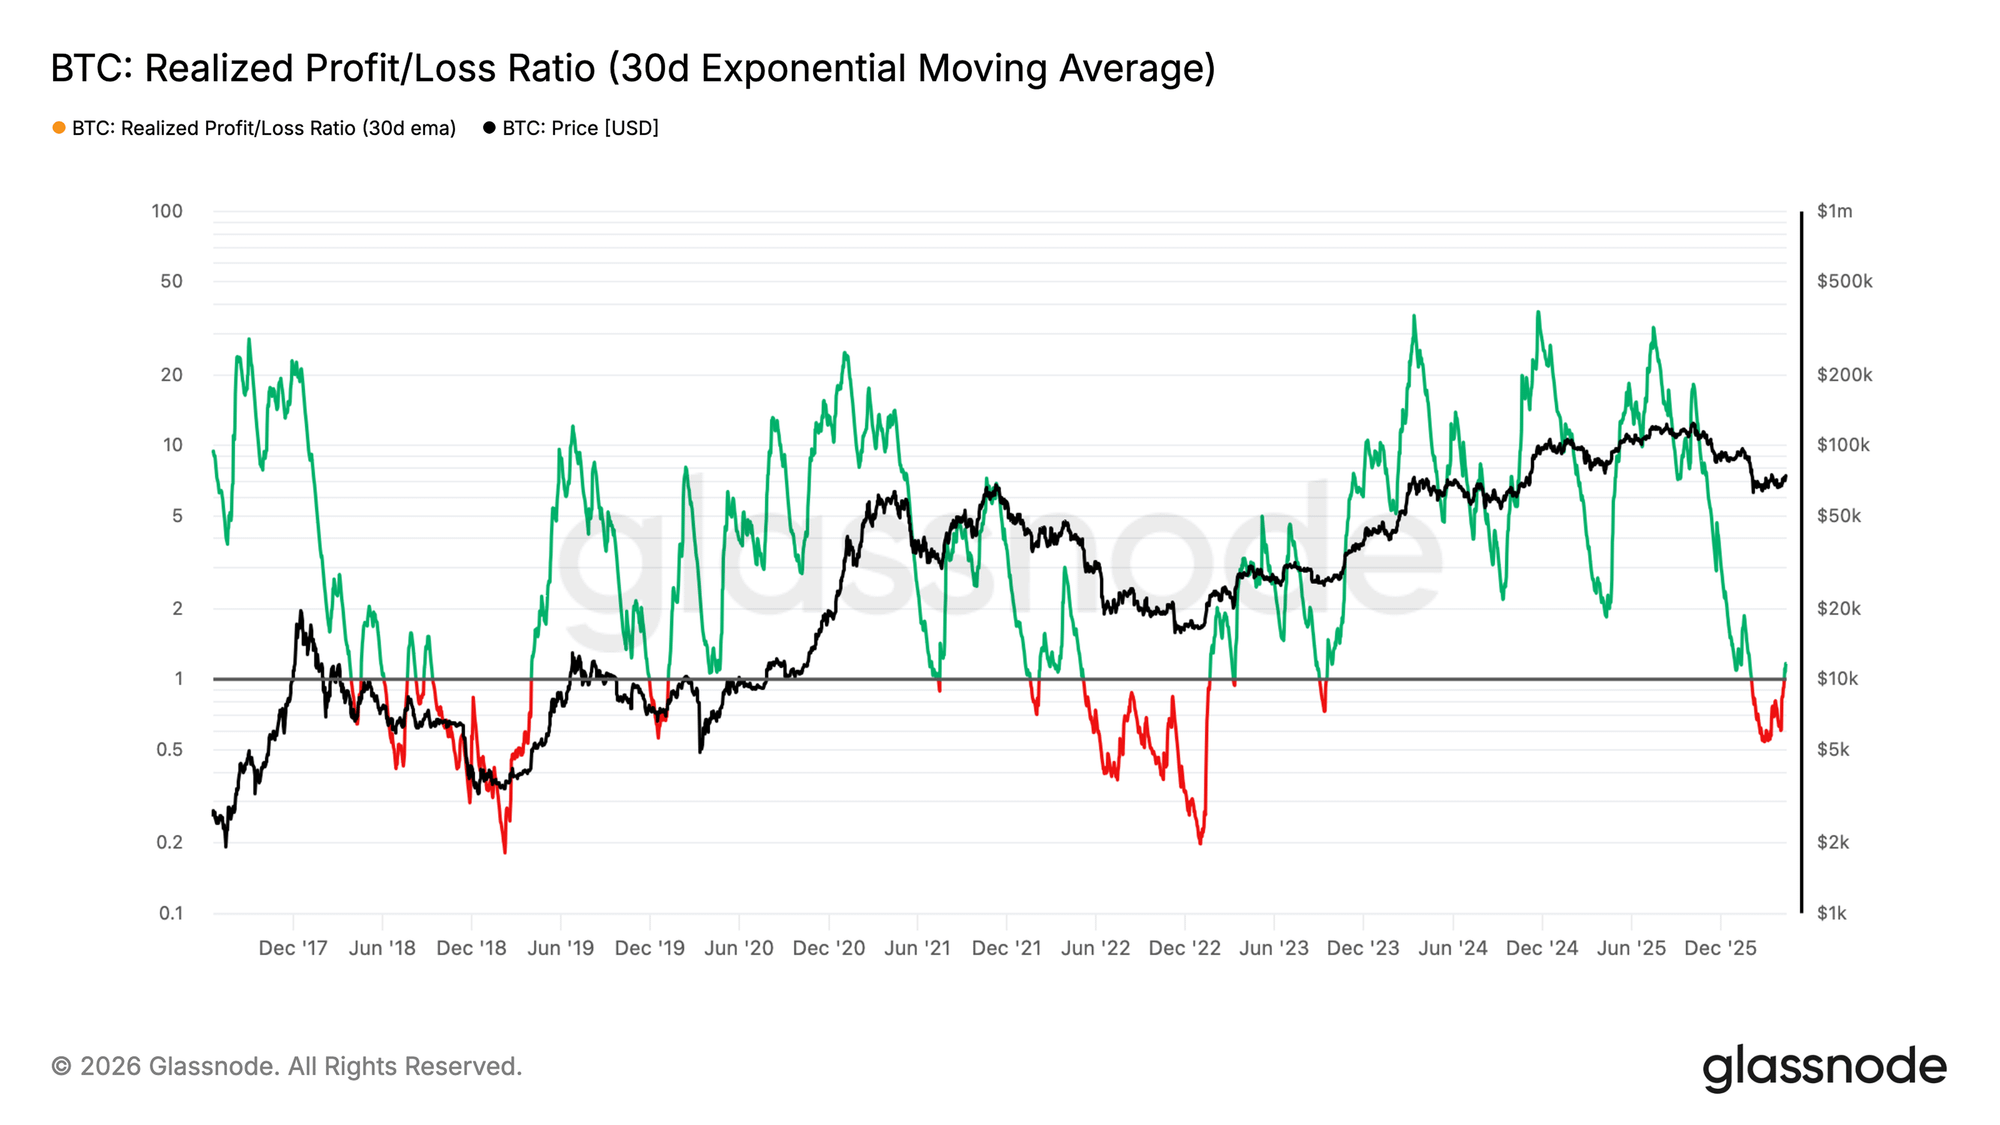
The third signal: Profit-taking is accelerating.
Glassnode's 30-day average of the "realized profit/loss ratio" is currently 1.16.
In other words, for every $1 loss incurred on the blockchain, $1.16 of profit is realized.
A ratio greater than 1 is not a problem in itself; it indicates that the market is recovering.
The problem is that the speed and manner in which this ratio rises has historically been a distribution signal, not a recovery signal, during bear market rallies.
Some people see the rebound as an opportunity to sell their shares.
📊 [Image 3] Realized Profit/Loss Ratio · 30-Day EMA
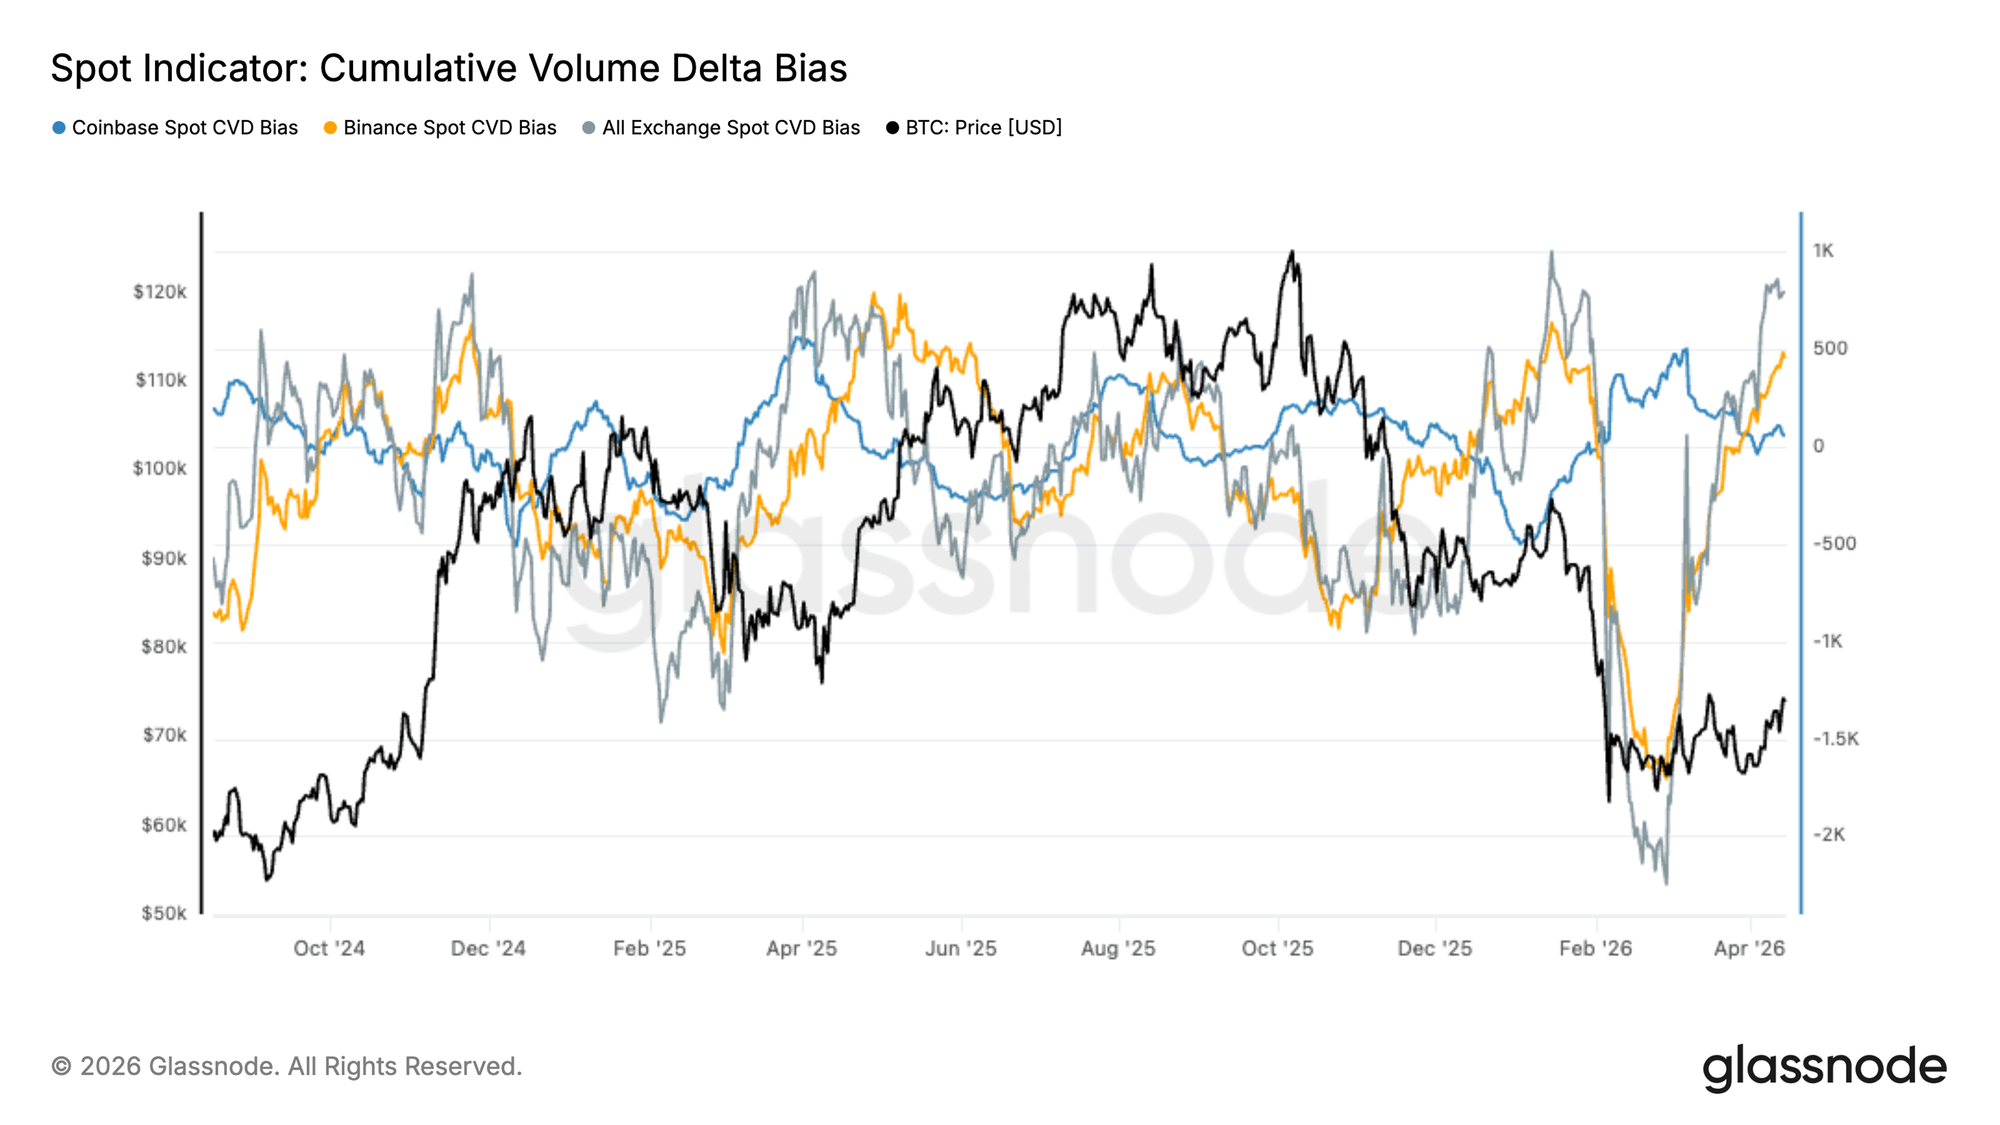
The fourth signal: Where are the buying orders coming from?
The spot CVD market has indeed turned positive.
But upon closer inspection—Binance is in control, while Coinbase lags behind.
In simple terms: It's retail investors and offshore funds that are buying; institutional investors haven't returned on a large scale yet.
Glassnode provided a judgment:
Sustained growth requires the participation of both groups; currently, only one group is moving forward.
📊 [Image 4] Spot CVD Deviation · Exchange Comparison
The fifth signal: Institutions are cautiously restructuring, not rushing in.
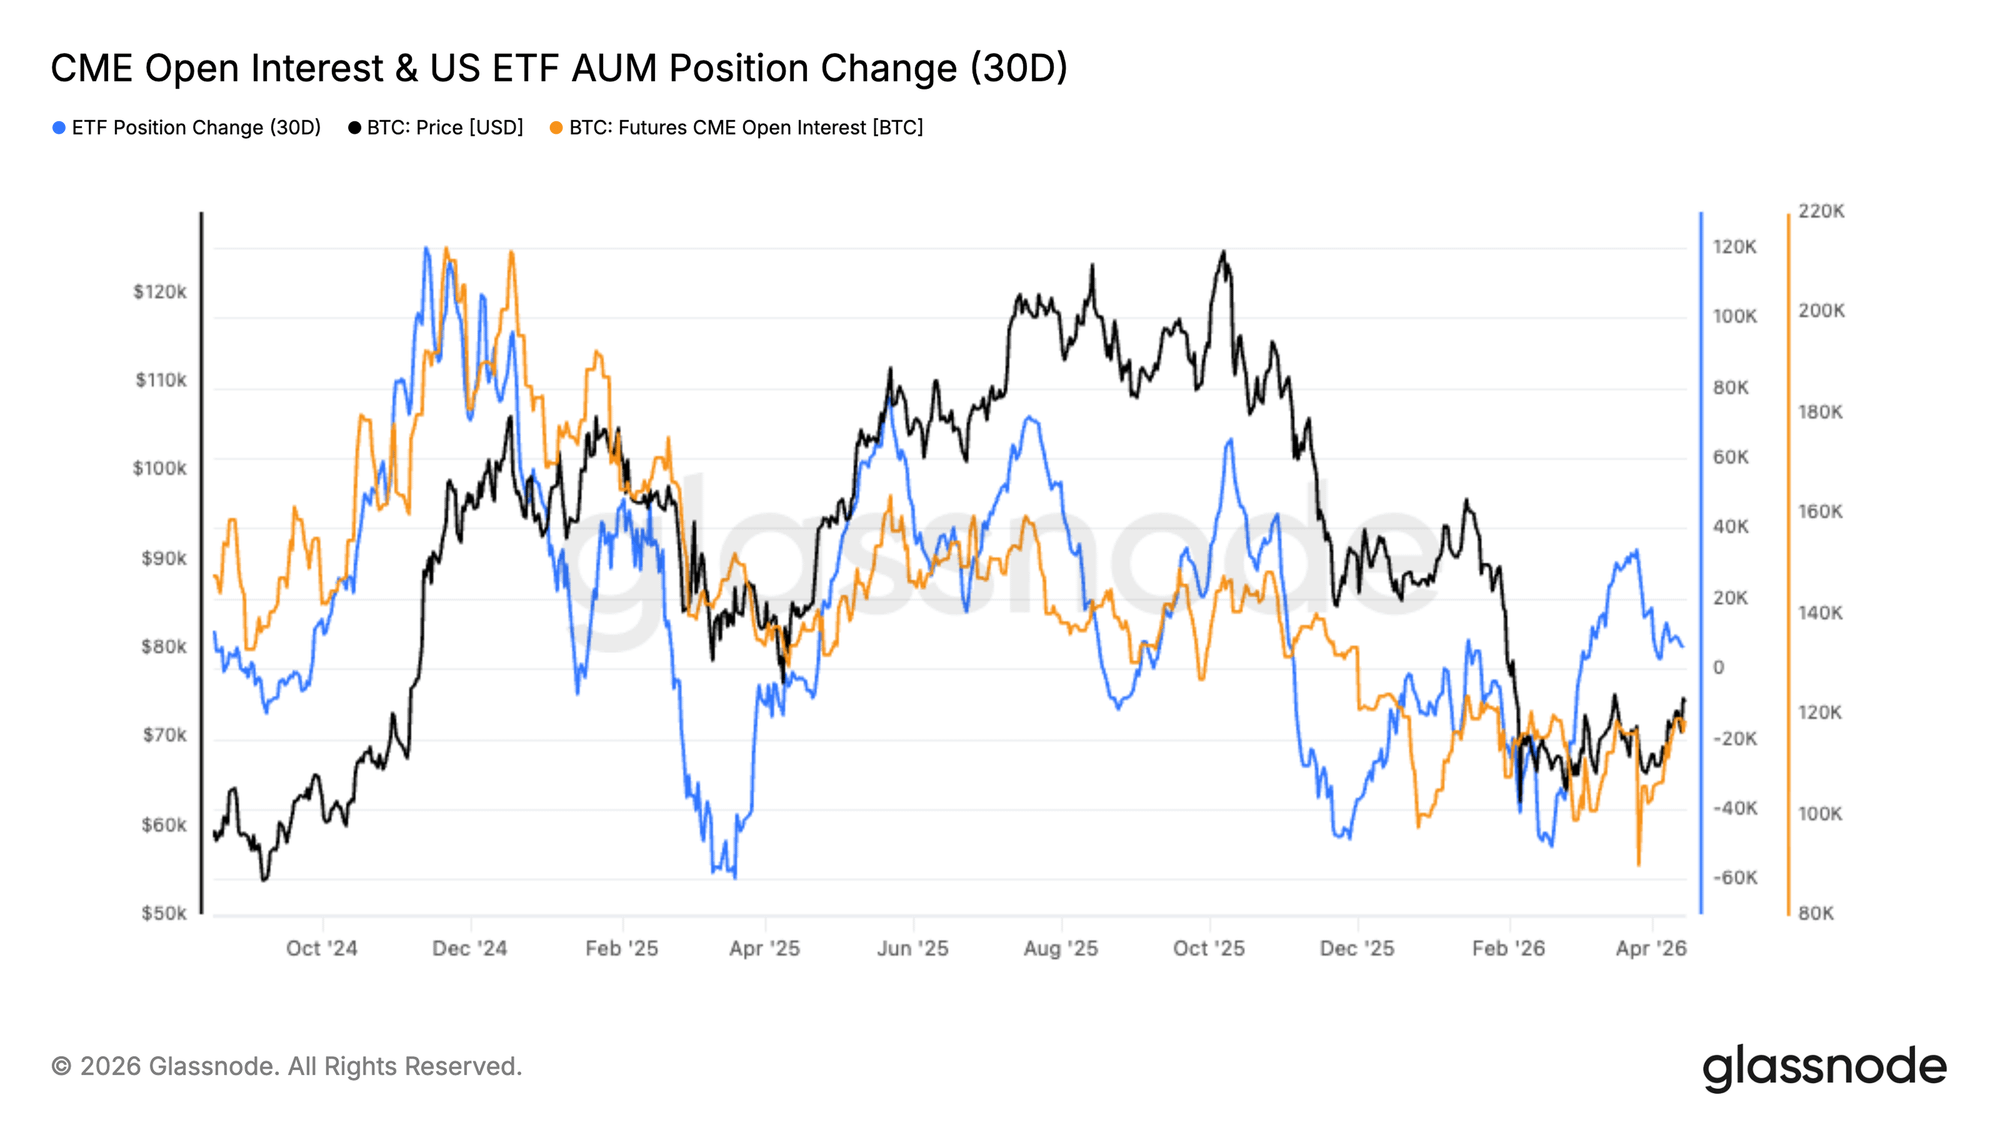
CME open interest and ETF fund flows have begun to rebound, but are still significantly lower than previous highs.
This isn't a full-scale bullish move; it's a cautious test.
📊 [Image 5] CME Open Interest & ETF Fund Flows (30-Day Changes)
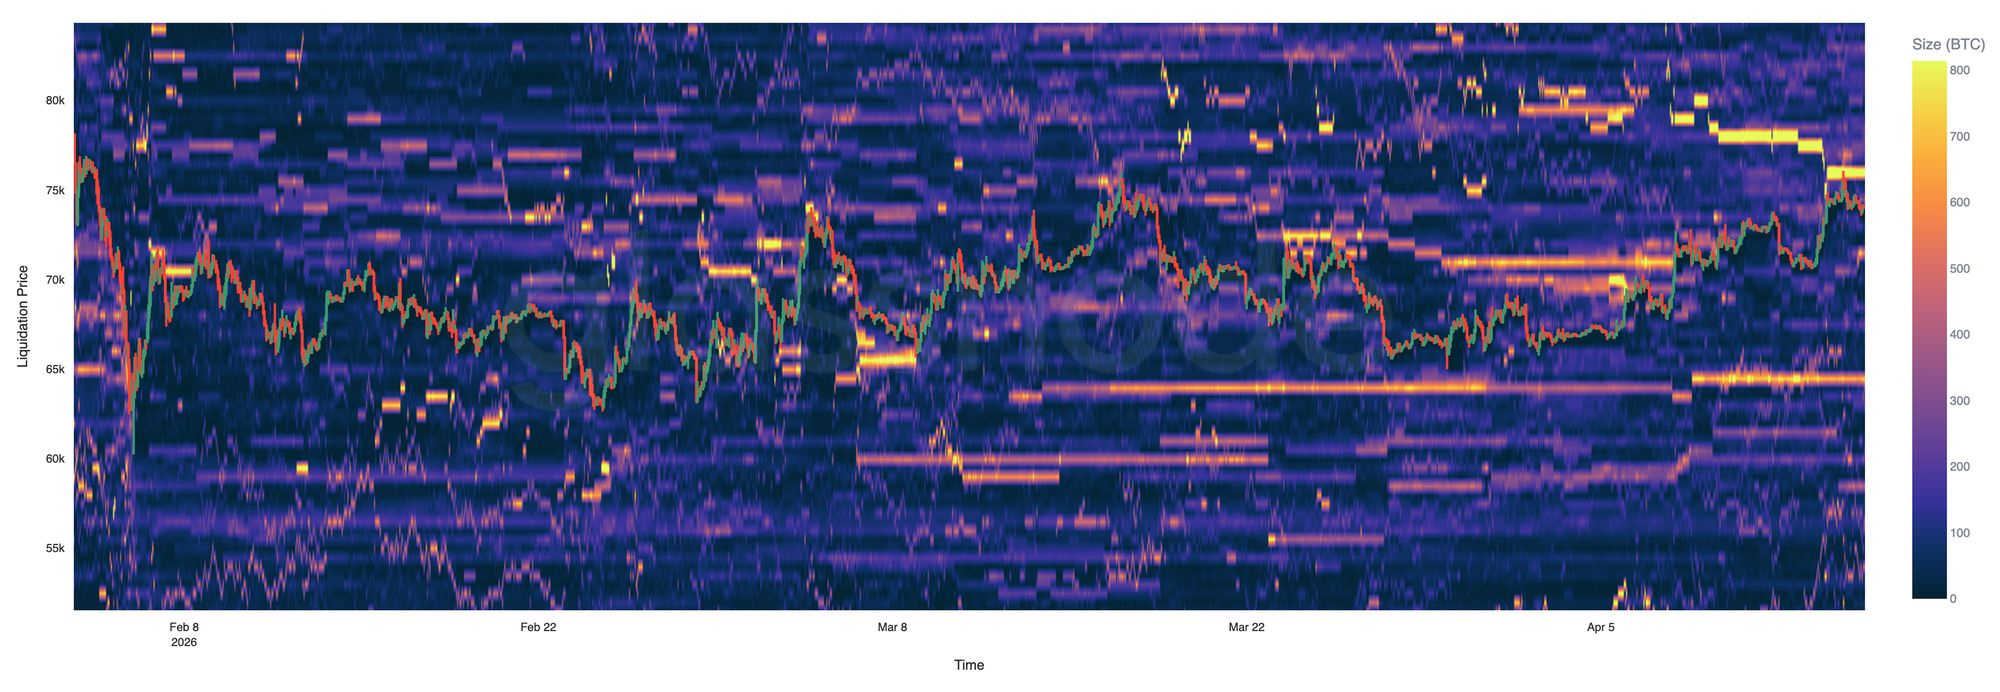
The sixth signal: Liquidation heatmap – price between two piles of explosives.
Hyperliquid data shows that prices are currently oscillating between the $63K-$65K long liquidation band and the $74K-$76K short liquidation band.
The recent rebound has touched the upper short-covering zone, but has not made a decisive breakthrough.
This trend is not a directional bet, but rather a passively driven movement due to liquidity.
📊 [Image 6] Hyperliquid liquidation heatmap
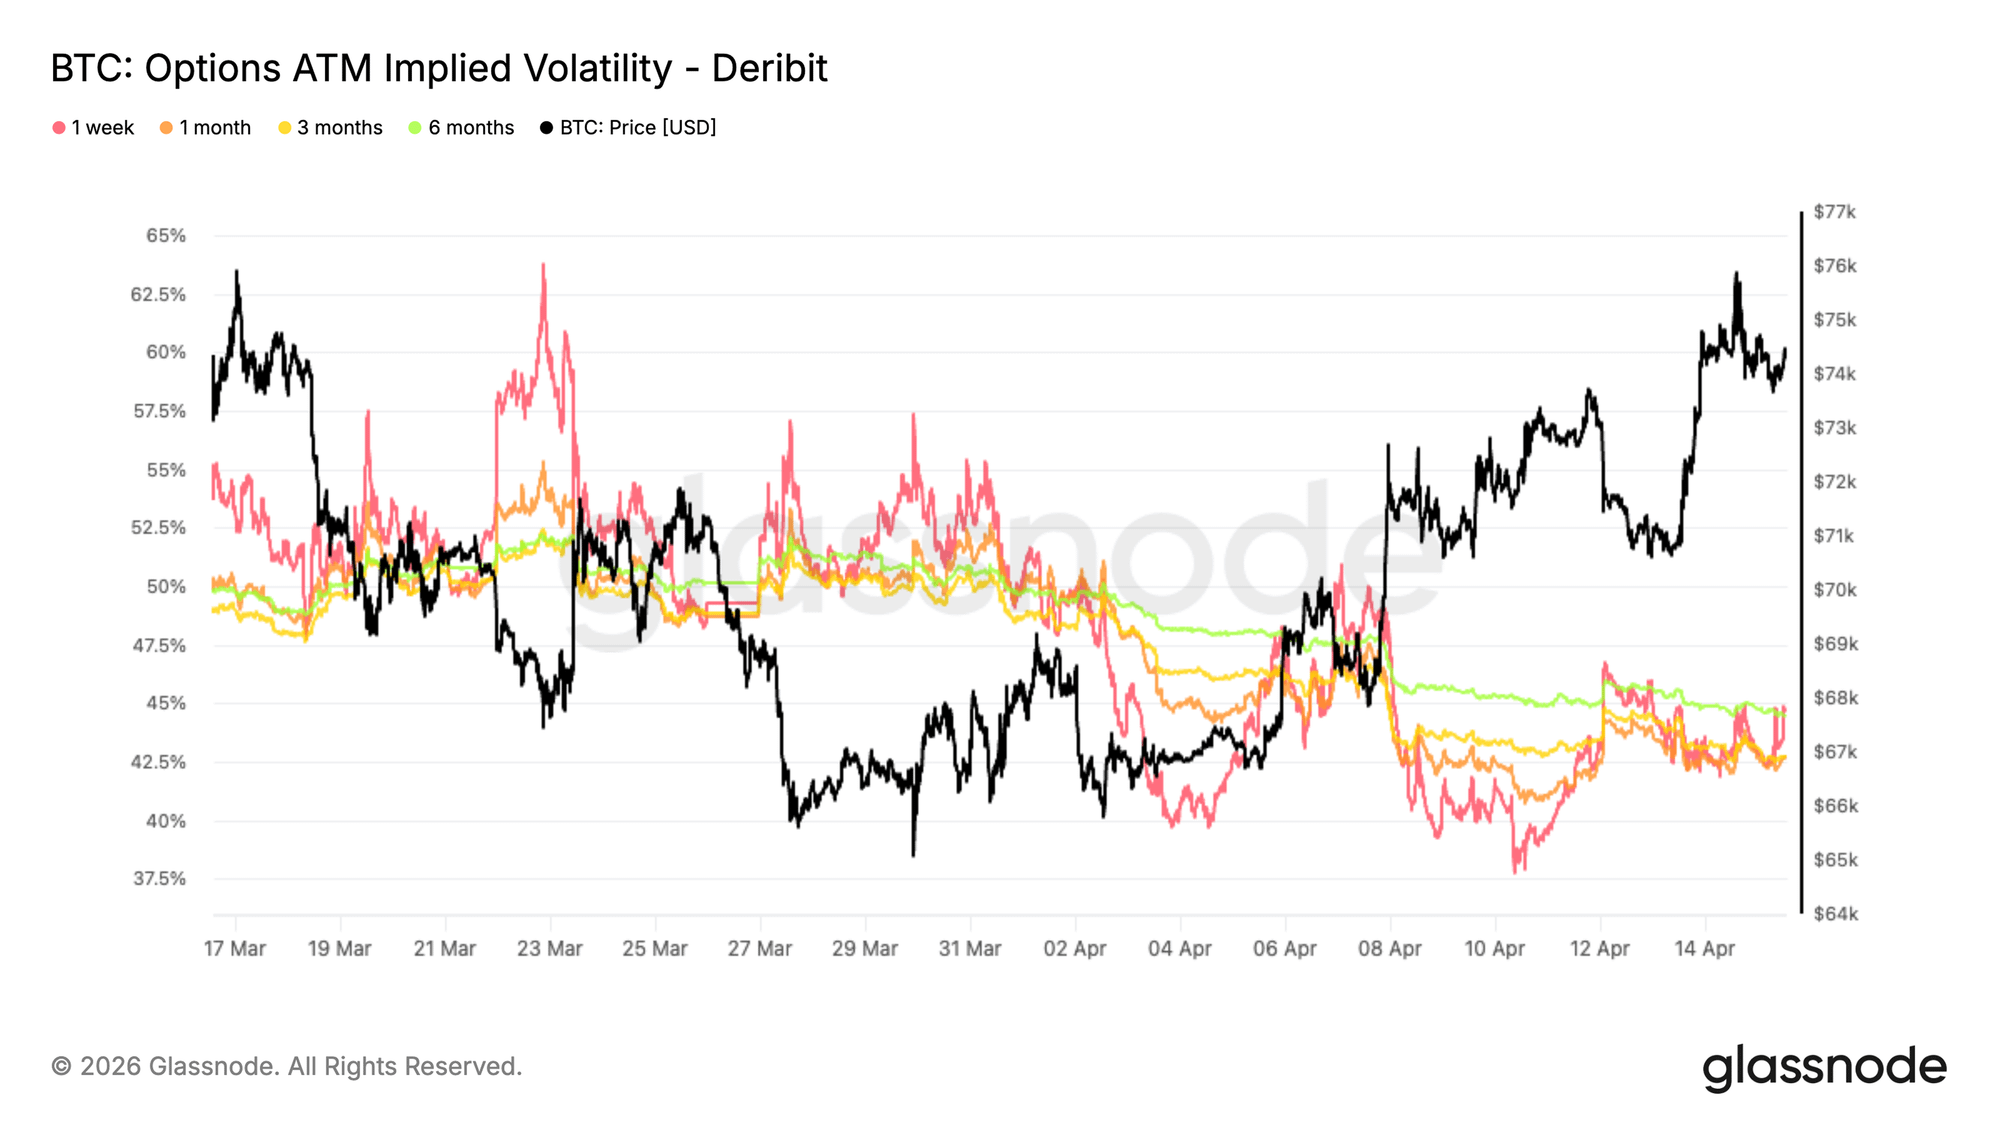
The seventh signal: The options market doesn't believe in this wave.
Implied volatility (IV) declined across the board, the term structure flattened, and 1-month volatility compressed to around 42.6%.
Prices rose, but volatility fell – the options market did not follow the pricing risk.
📊 [Image 7] BTC Options ATM Implied Volatility · Deribit
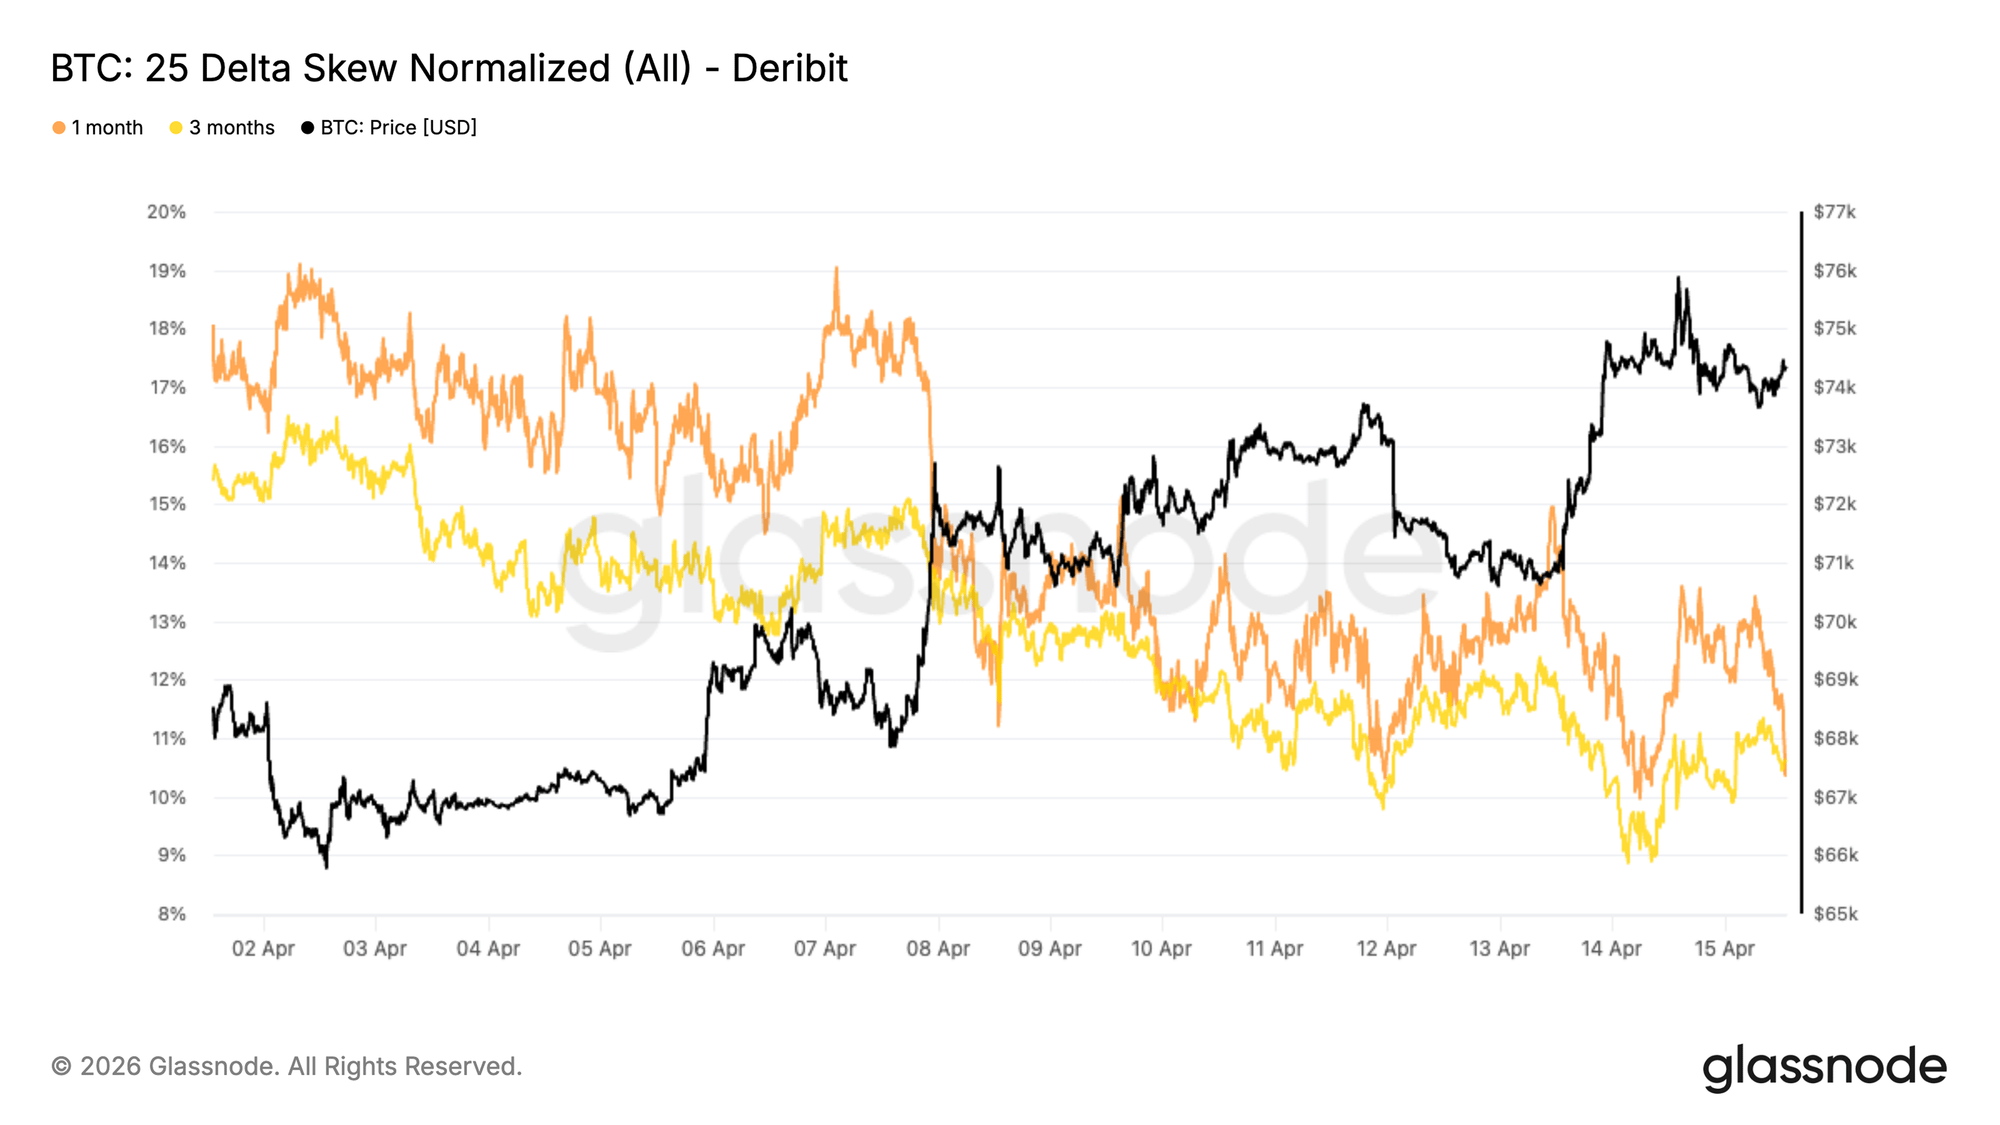
The eighth signal: The 25-day Delta skew remains bearish.
Despite overall calm in volatility, put options still command a premium over call options.
The skewness dropped from a high of the teens to a low of the teens, but it never turned positive.
Beneath the surface, the market remains cautious.
📊 [Image 8] 25 Delta Skew (Full Time Limit) · Deribit
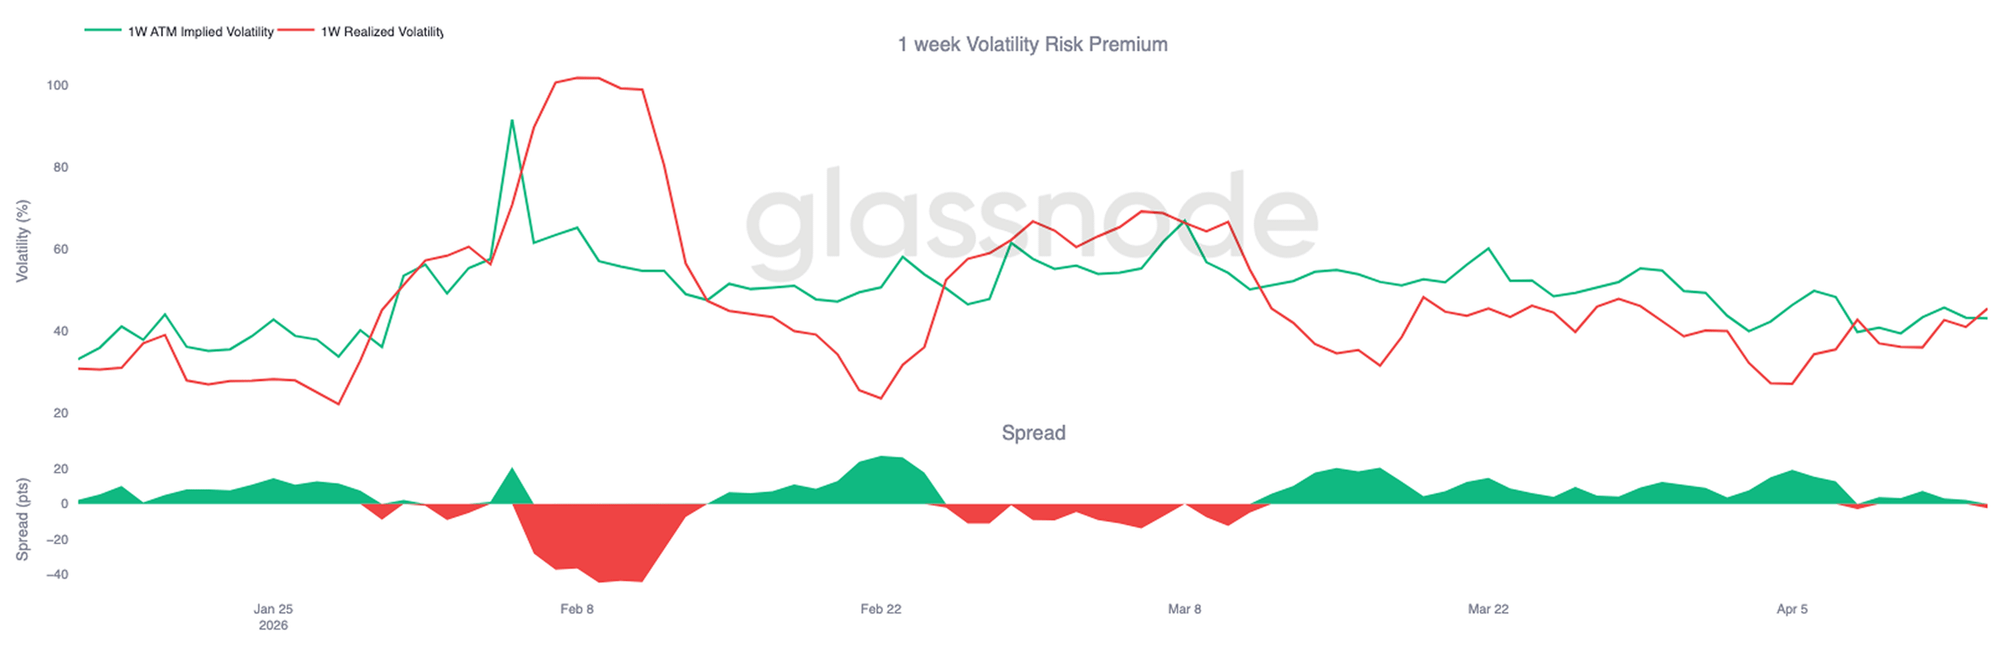
Ninth signal: 1-week VRP turns negative – Options underestimate actual volatility.
Realized volatility (~45%) in the short term is higher than implied volatility (~43%).
The options market underestimates actual volatility, leading to an inverted premium.
This is not a sign of stability, but a sign of mispricing.
📊 [Image 9] 1-Week Volatility Risk Premium (VRP)
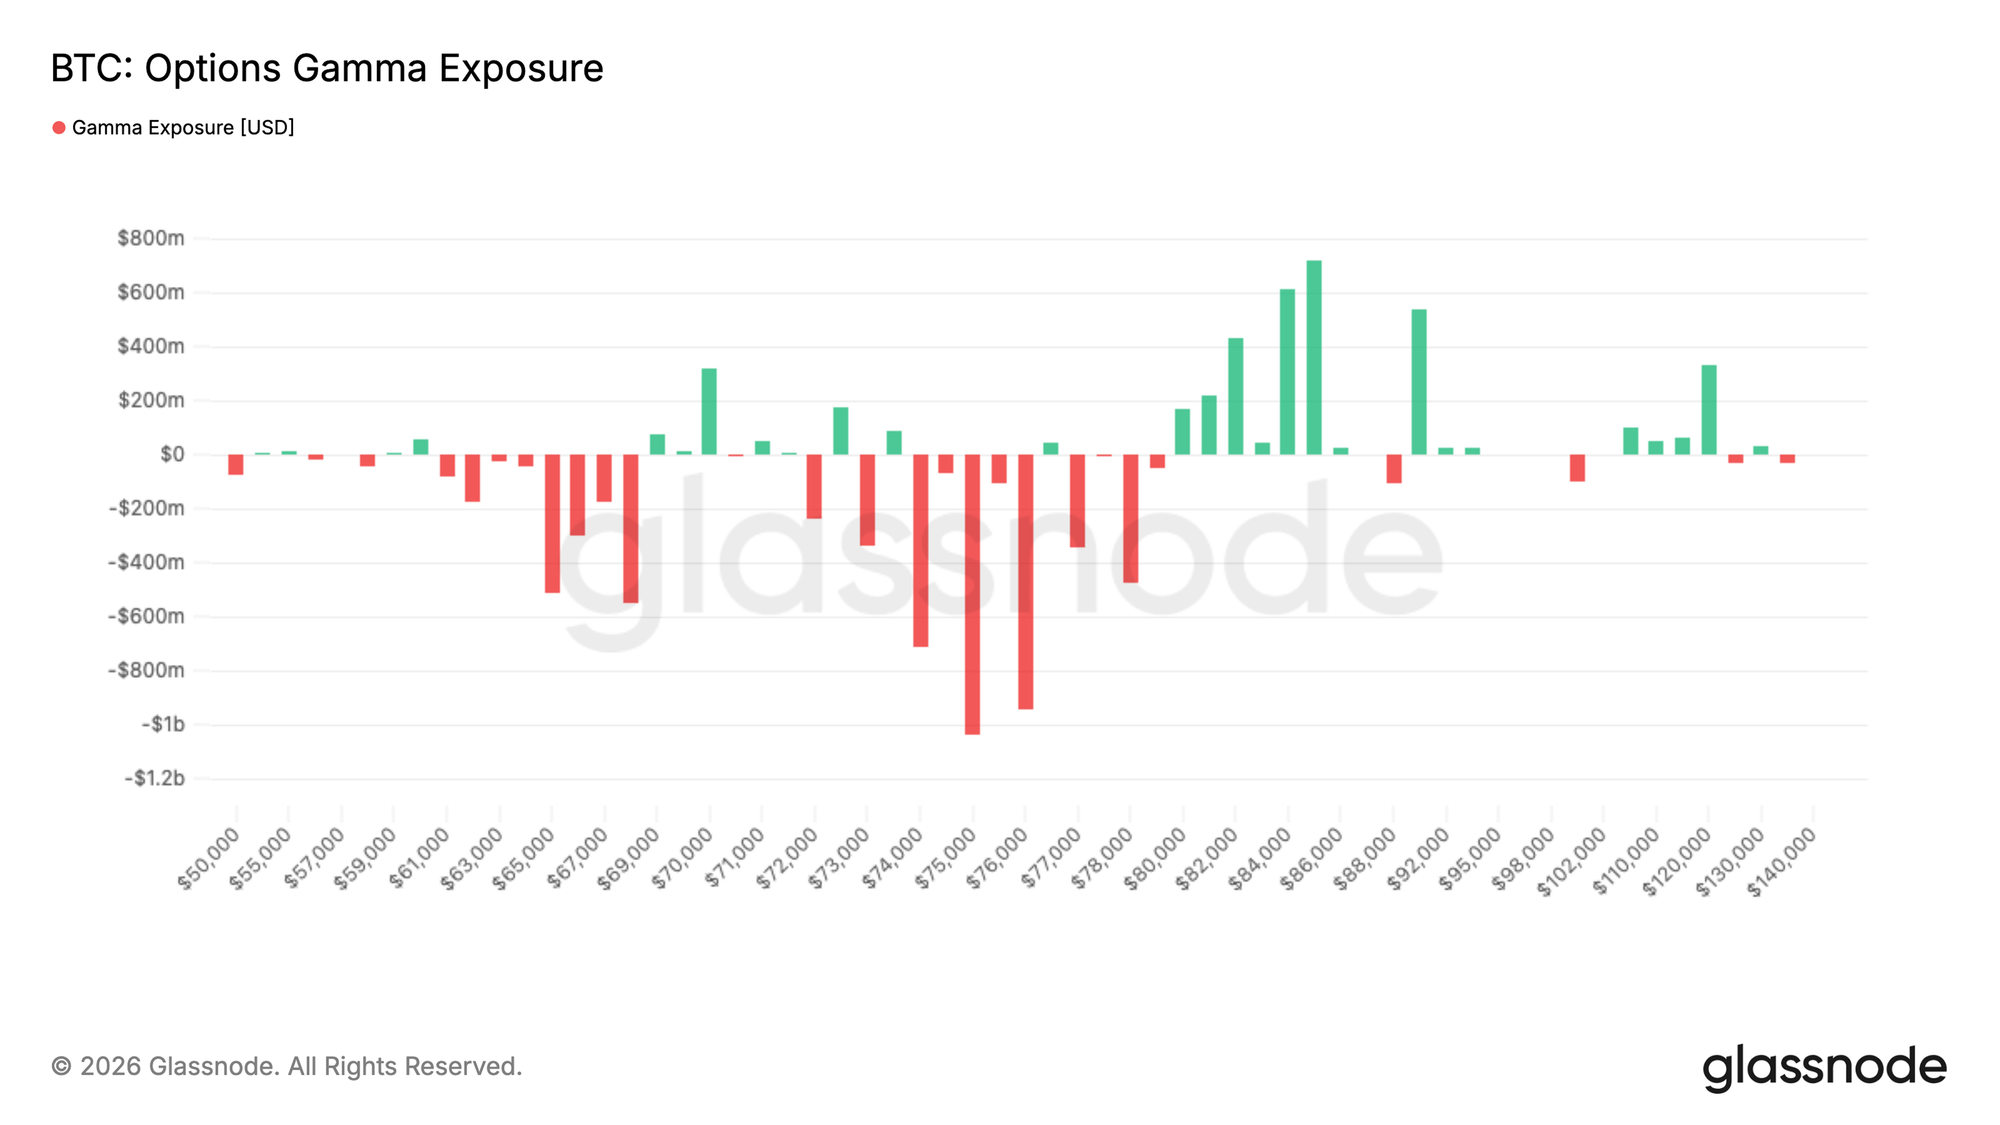
The tenth signal: Negative Gamma is concentrated in the $74K-$76K range.
Market makers have approximately $3 billion in negative Gamma exposure in this range.
Negative Gamma means that the higher the price rises, the more market makers will buy to hedge.
This structure itself will help propel upward movement.
However, once the direction reverses after the breakout, the same mechanism will accelerate the decline.
📊 [Image 10] BTC Options Gamma Exposure Distribution
Overall assessment:
There's still room to rise; the higher you go, the heavier the selling pressure becomes.
Whether it can reach 78,100 depends on whether there are enough buyers to absorb the selling pressure above.
The biggest gap right now is that not all institutions have fully returned.
One question:
Do you think this wave will reach 78,100?
Do you think the price will first fluctuate between 74,000 and 76,000?
Follow me for continuous tracking of key data.
Data source: Glassnode Weekly Report, April 18, 2026