The shape of the chips - this is the first;
The direction of stock price movement - this is the second;
The color of dynamic chips - this is the third.
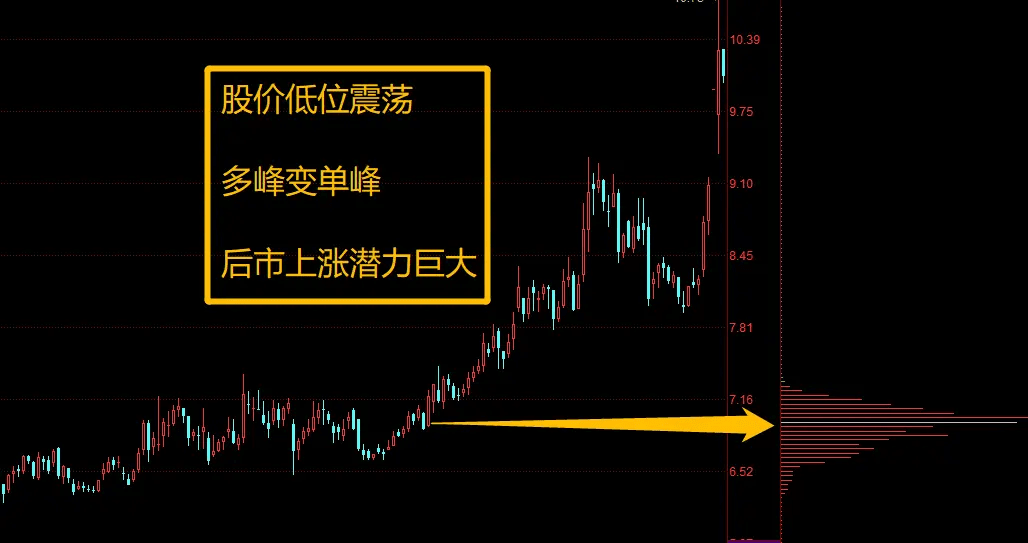
First move: Break through low single peak density
When the stock price has gone through long-term consolidation and forms a concentrated moving cost distribution at a low level, and the stock price breaks through the concentrated single peak, this is a signal for an upward trend!
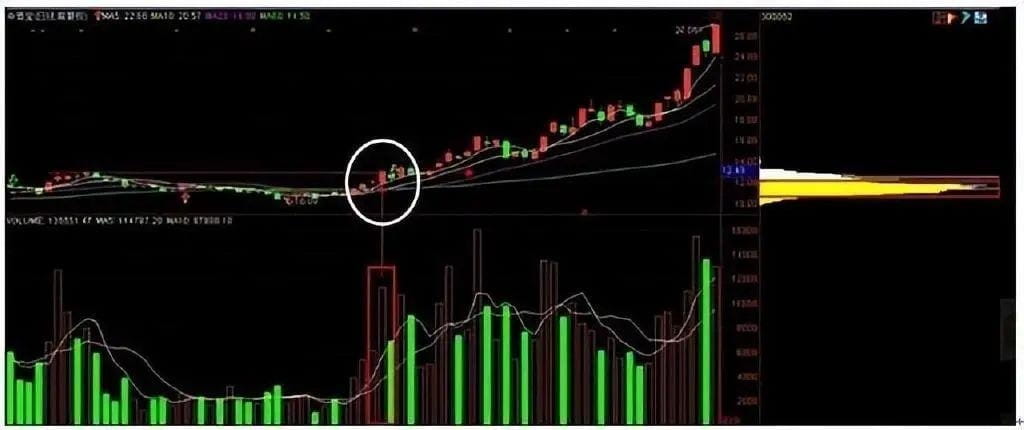
1. The larger the single peak density, the more sufficient the chip conversion, and the stronger the upward trend; a high single peak at a high level means that the upward space is completely opened;
2. Confirm relatively low from historical trends;
3. The longer the formation time of single peak density, the higher its reliability;
4. Breakthroughs must have large trading volumes;
5. The stock price has broken through the dense peak top and created a recent high point.
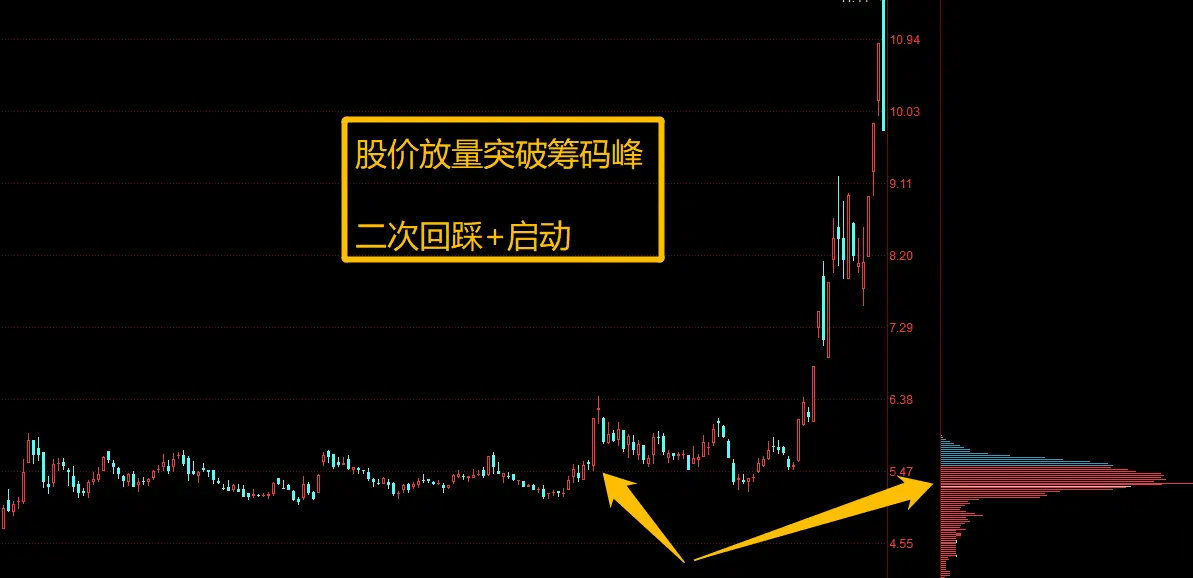
Second trick: rising multi-peak dense continuation.
After a period of dense lows, the stock price begins to rise, creating one or more dense peaks during the upward process, and the rising market will continue.
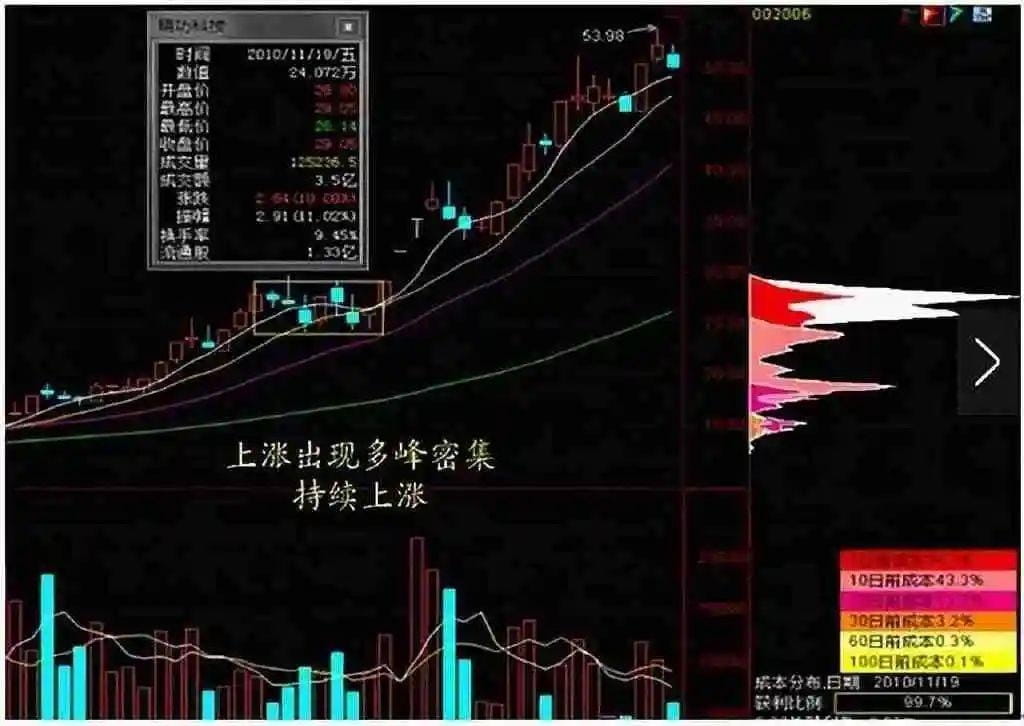
1. The oscillation and consolidation during the rising process is a washout nature;
2. Although the new peaks are decreasing, there are still new peaks;
3. When new peaks increase, the original high-density peaks decrease rapidly; it is advisable to exit and observe.
4. Each peak will be a strong rebound washout for this stock.
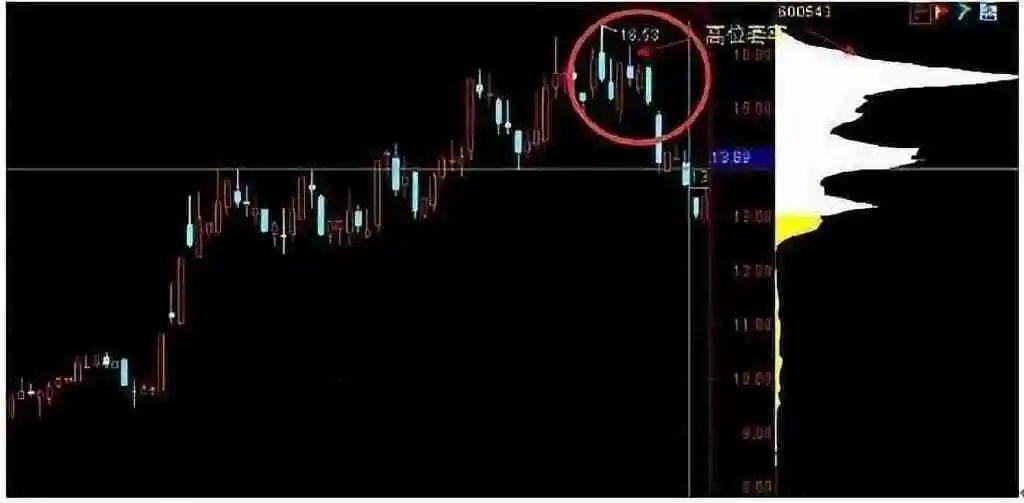
Third trick: Break through high-density single peaks.
After a round of rising, a dense single peak appears at a high level. If it breaks through the peak again, it marks the beginning of a new wave of rising.
1. After a round of rising, a high-level single peak has formed;
2. The stock price must break through the recent historical high point;
3. Set the high points that the stock price has dropped below as stop-loss points;
4. Short-term operation strategy;
5. Beware of false breakthroughs and genuine distribution.
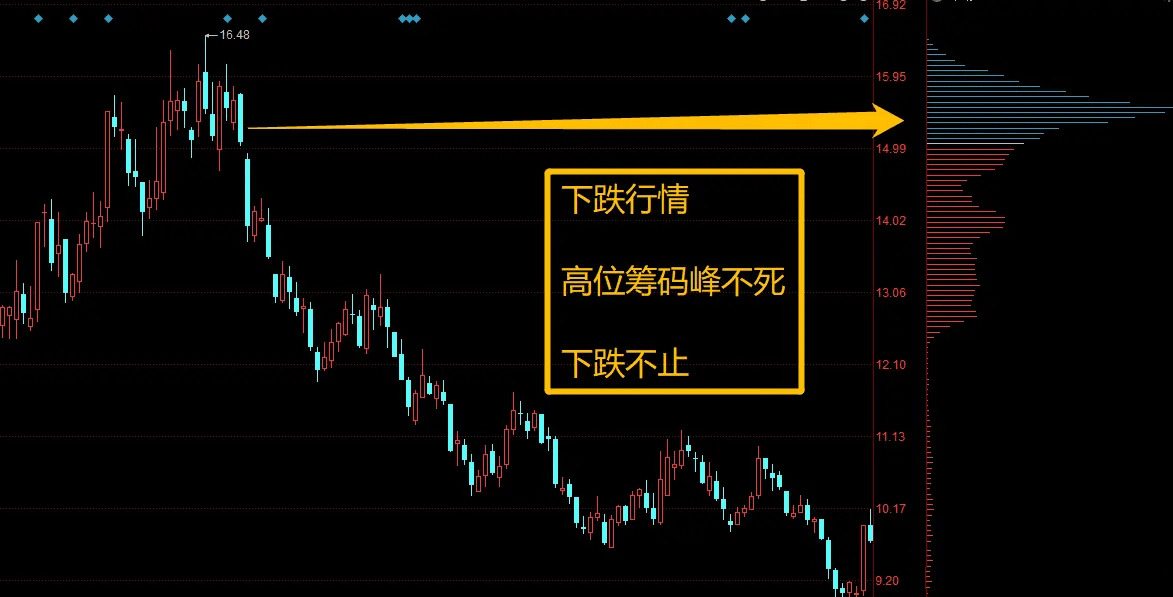
Fourth trick: as long as the peak is alive, the bear market won't stop.
In a downtrend, if the upper dense peak is not completely exhausted, and a new single-peak density forms at a low level, a new wave of market will not appear.
1. The sufficient premise for a rising market is that there is no large amount of locked positions above the stock price.
2. A peak density appearing at a low level indicates stabilization after a drop.
3. Each peak of the multi-peak downward is a powerful resistance position.
4. For stocks with downward multi-peaks, it is not advisable to rush to build positions.
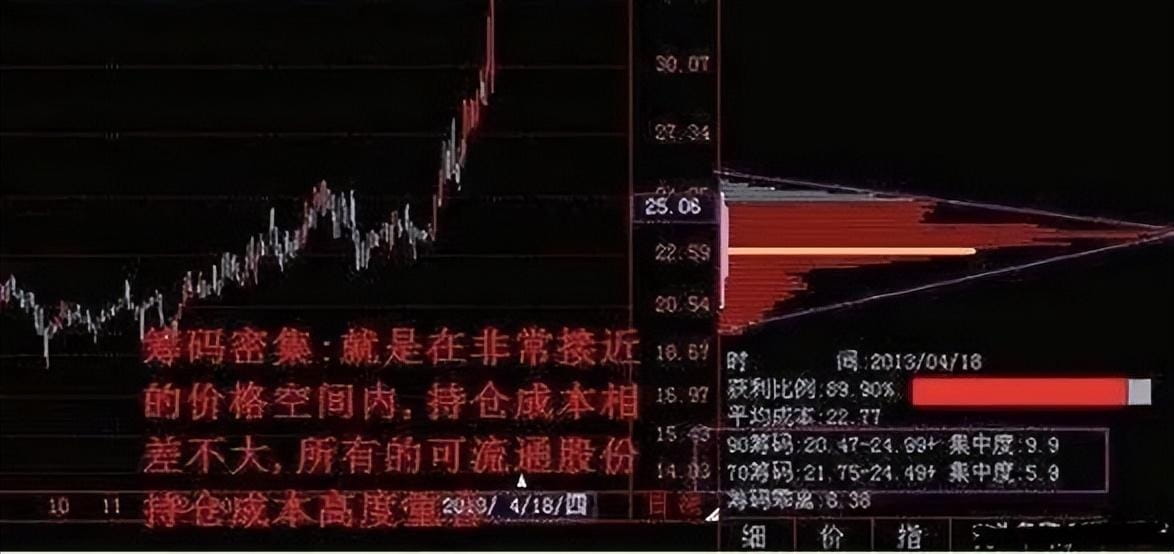
How to read the chip distribution chart?
Through chip indicators, we can gain information about the main force's cost. The different positions of chips indicate different cost prices for the stock. When we look at the chip peaks, we mainly observe the transfer of chips for that stock. Of course, in the market operation, the performance of chip cost movement distribution is: divergence - density - divergence again - density again - divergence again. It is a cyclic process, and when we use chip peaks to select stocks, we mainly look at the performance of chip distribution.
The chip distribution chart is still a very meaningful 'topographic map' that can represent various aspects of stock information such as pressure, support, control degree, and activity level.
Its identification has several basic concepts: single-peak chips, multi-peak chips, missing chips, etc. See the figure below.
1. Single-peak chips can be divided into bottom single-peak chips, top single-peak chips, and single-peak chips during the rising process. They can also be classified by shape into needle-shaped chips and triangular chips.
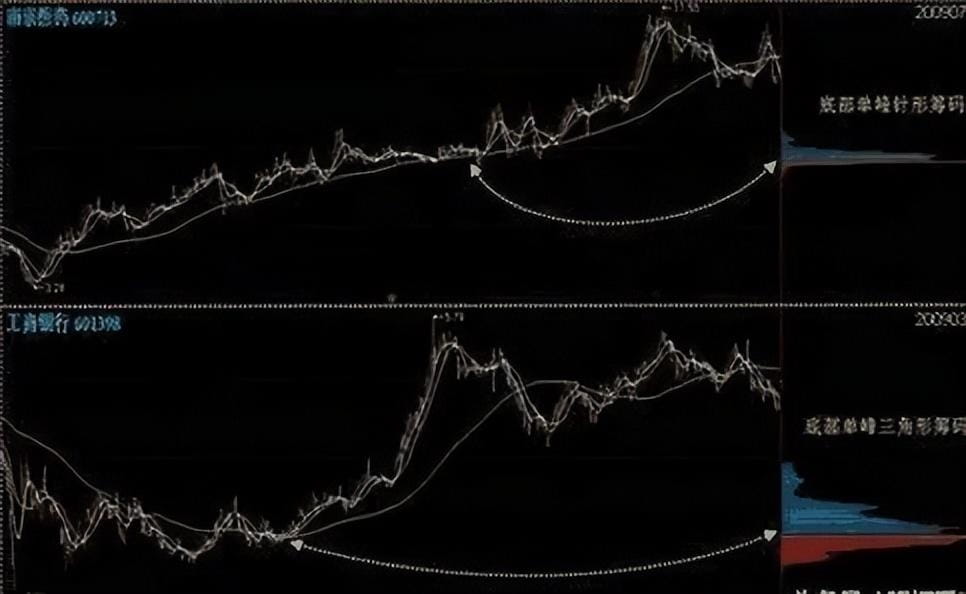
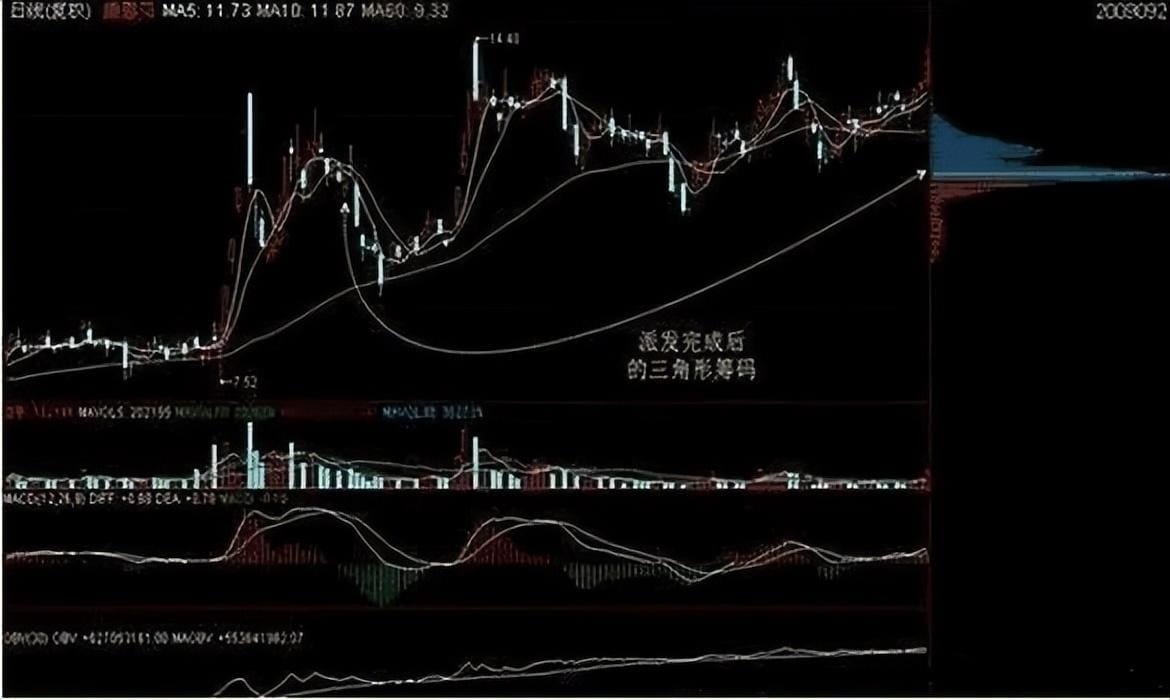
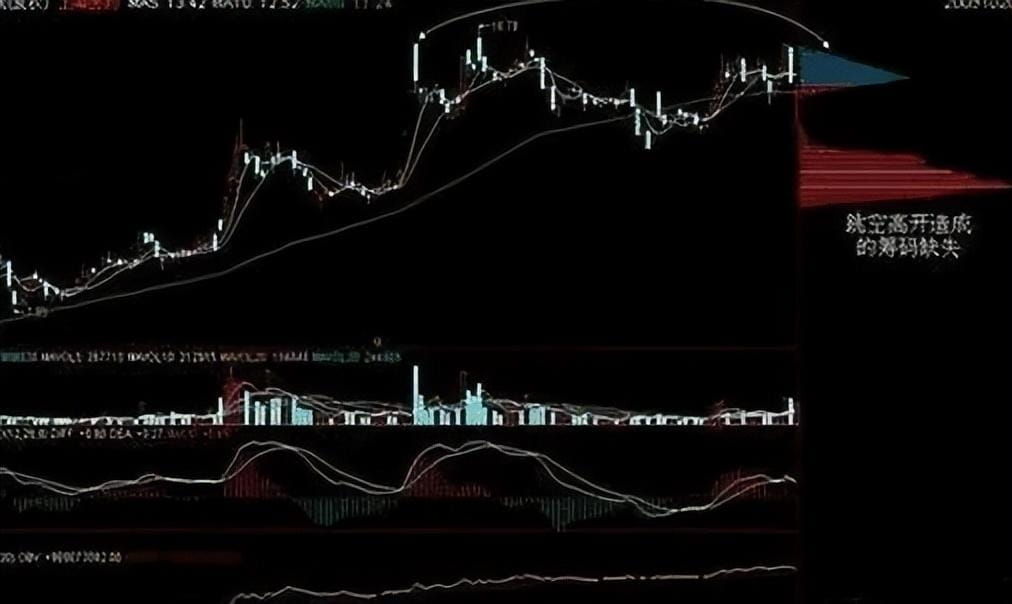
Top single-peak chips: After a round of significant price increase, the main force distributes at a high-level platform area. The bottom chips disappear, forming a high-level single-peak chip area. The chip shape after the distribution is generally triangular.
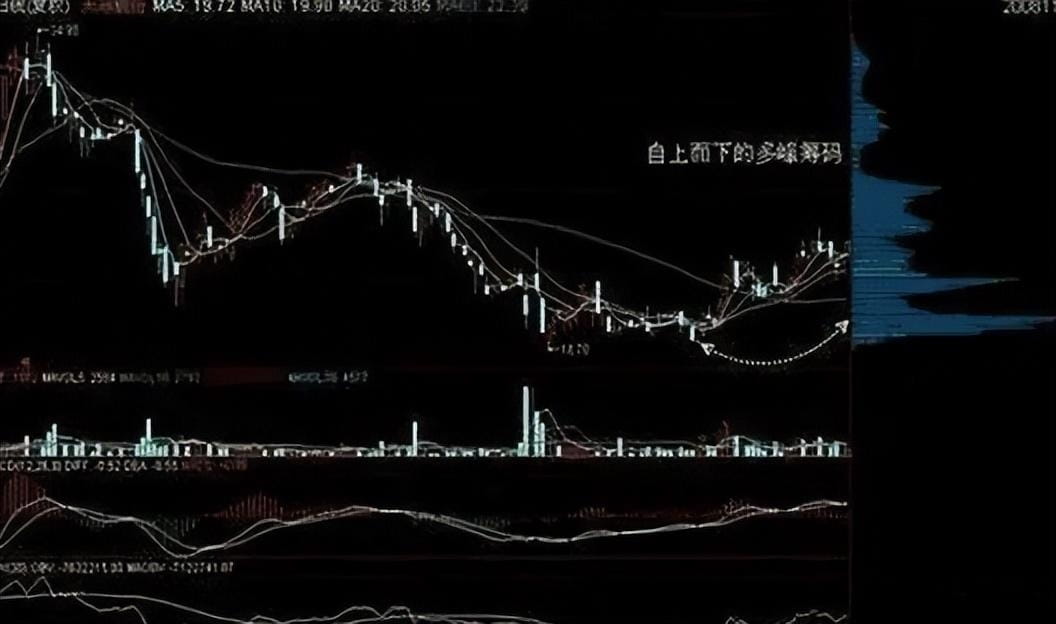
2. Multi-peak chips: Diverging from single-peak chips. They can also transform from multi-peak chips into more peaks. Another characteristic of multi-peak chips is that their formation can occur from the bottom up or from the top down, representing a bullish or bearish market, with the market concepts and meanings of both being completely opposite.
3. Missing chips: When stock prices rise or fall rapidly, due to the short time spent in these price regions, chips are scarce, resulting in chip hollows, referred to as valleys (between peaks). When stock prices rise or fall sharply and gap up or gap down, and there is no subsequent filling of this gap, the chips will not have continuity, and this is now referred to as missing chips. When the stock price drops back to the missing chip area, there will be strong support, and when the stock price rises to the missing chip area, there will be strong resistance. Because of the existence of continuous price limits and continuous down limits, the precise positions of support and resistance cannot be judged by chips. At this time, using gap knowledge to analyze, explain, and guide operations should be more comprehensive.
Chip missing caused by gap down is relatively rare. Because in a bear market decline, it is usually decline - stabilization rebound - then gap down. In this way, the chips that gathered at the stabilization rebound position occupy the gap down area. Even if there is a chip missing due to a gap down, it is generally filled by a small wave rebound.
Through chip analysis, we can judge the main force's intentions:
1. Accumulation phase:
A person who wants to profit can only do so through the most basic trading principle: buy low and sell high, making a profit from the price difference.
During the main force's accumulation phase, cheaper chips are also needed. In the accumulation phase, various false technical patterns may appear, such as M-top, five-wave sell-off, and violent rise, etc. The main force holds an absolutely dominant position in the market, so they take advantage of the opportunity to suppress the price, keeping the stock price in a horizontal range for a relatively long time. This causes very few investors to dare to hold stocks for a long time, resulting in the previous round of high-level locked investors continuously cutting losses, allowing the main force to accumulate at low levels.
2. Rising stage.
After the main force completes accumulation, the next step is to let the stock price break away from its cost area and open up profit space.
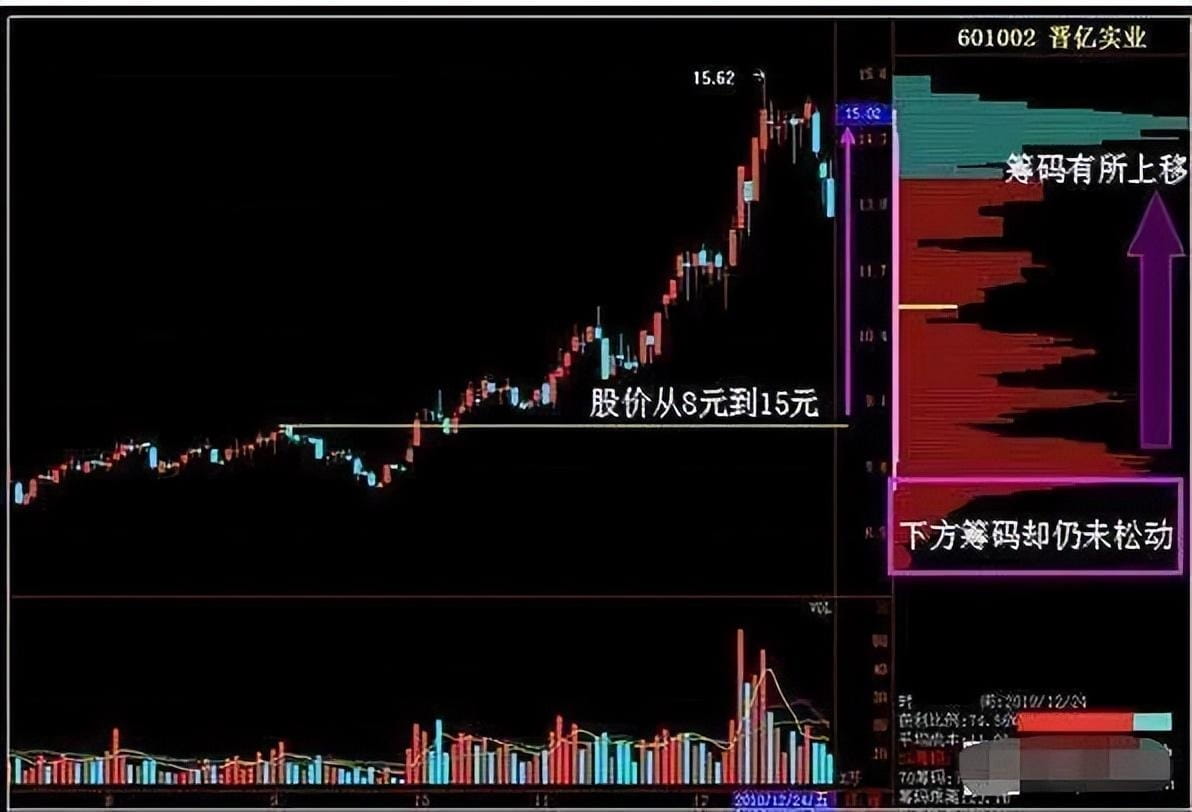
During the rising process, retail investors continuously chase prices, while the fear of heights leads them to take profits. The main force takes advantage of this to sell and buy simultaneously, continuously raising the stock price, forming a seamless 'lifting plan.' In the figure below, chips begin to move upward from the concentrated area at 8 yuan but a large amount of low-level chips still exists at 8 yuan. This means that during the rise from 8 yuan to 15 yuan, the main force did not intend to fully sell off.
3. Distribution stage.
After the stock price continues to rise, the main force's profit space is full, and the next step will be to realize the profit.
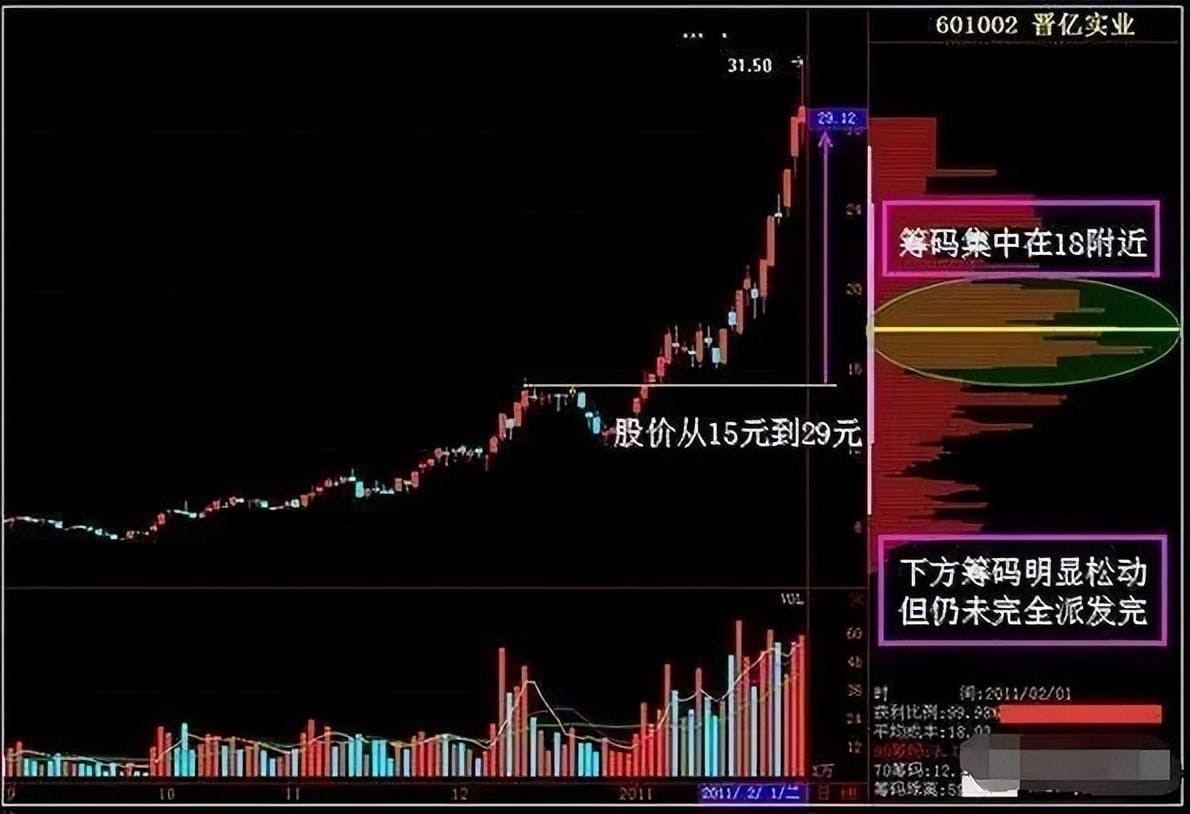
Since the main force holds a large number of chips, a significant turnover is needed to complete the distribution. Therefore, during the continuous rise of the stock price to new highs, its trading volume continuously increases, and the turnover rate increases, giving the main force a good opportunity to distribute chips.
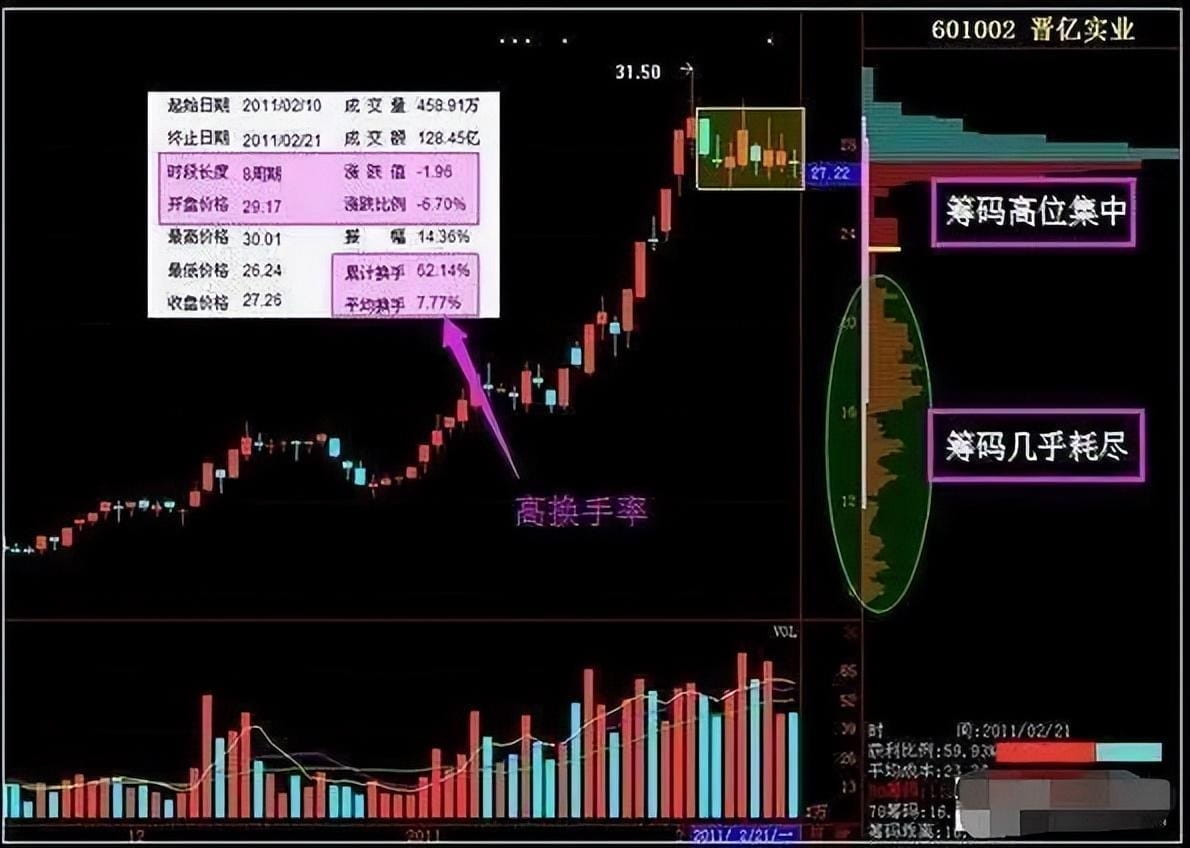
4. Increase to distribute.
The main force usually forms a stage of horizontal adjustment after the rapid rise ends, and during the adjustment process, it continuously pulls up large bullish candles, making people feel that the rising market has not ended.
At the same time, the individual stocks often have horizontal candlesticks with high turnover rates, allowing their chips to be cashed out.
The above are several processes by which the main force manipulates stock prices, but the time is relatively long. As long as we are clear about each stage, we can make good use of this characteristic to keep up with the main force's operations. If you are still blindly chasing prices, you must understand how the chips are distributed and complete the finishing work; otherwise, you will easily become a victim of the main force's distribution.
You don't believe it? When trading stocks, the main force is most afraid of retail investors focusing on one place! The chip distribution chart at the lower right corner of the candlestick, these six shapes, I use them like a fish in water!
What exactly is a chip distribution chart?
Chip distribution, also known as cost analysis, is a tool for finding leading stocks. It reflects the number of shares held by the main force and retail investors at different price levels. By moving the cursor on the candlestick chart, one can see the process of chip transitions between the main force and retail investors.
As long as trading is continuously occurring, chips will change. When trading volume is large, it must be the main force and retail investors exchanging chips. I have successfully judged the signals of the main force's rise multiple times through this technique of chips and have also obtained many leading stocks.
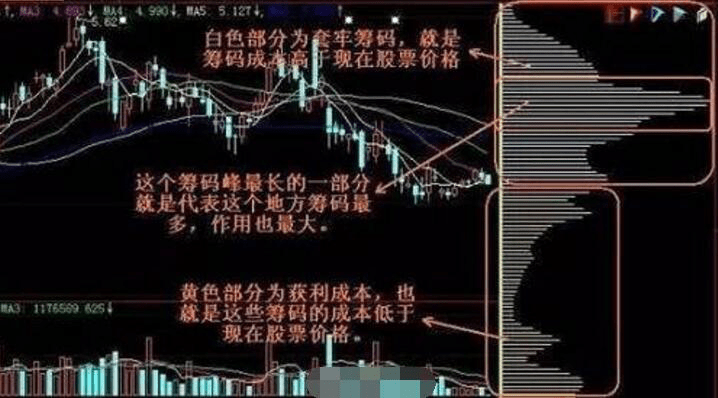
Remember the three types of chips.
There are three colors of chips: blue line is locked positions, red line is profit positions, and white line is average cost. This way, we know that the locked positions above are huge, and the upward pressure restricts the stock price. We generally won't touch it!
Below, I will share six rules for chip analysis. Combining with practical case studies, everyone should study more!
1. When the stock price is at a low level, if multiple chip peaks gradually become a single chip peak, the bottom is established and the market starts to rise.
2. In a rising market, if the volume breaks through the chip peak, the rising market will accelerate.
3. In a rising market, the stock price breaks through the previous high with volume, indicating that the stock price adjustment and washout for low buys begin.
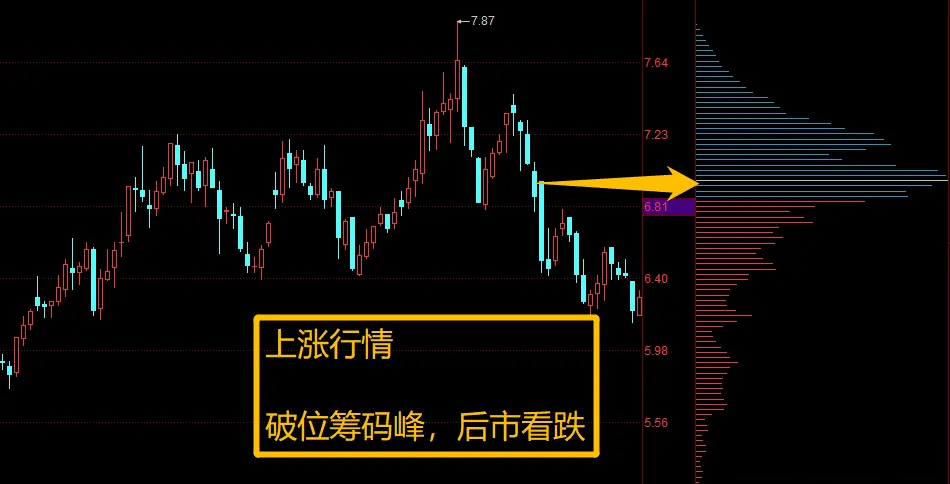
4. In an uptrend market, if the stock price breaks through the dense chip area, the future market is bearish.
5. When the stock price is at a high level, the locked positions in the high-level chip peak do not change, and the downward pressure does not disappear.
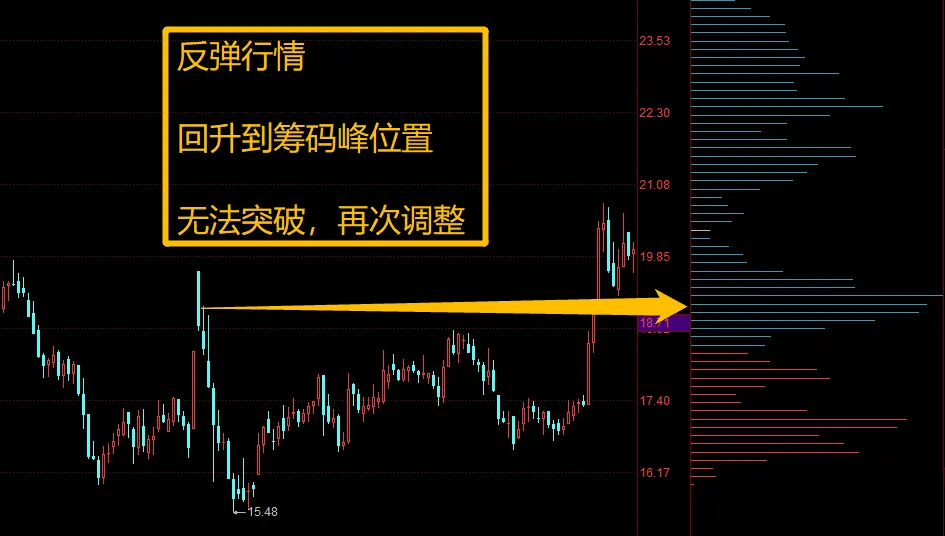
6. In a rebound market, when the stock price rebounds to the dense chip peak, the large locked position pressure suggests to exit and observe.
After everyone likes and collects, they can slowly study and watch, and you can also forward it to those in need. If there are different opinions, you can leave a message in the comment area.
The application principles and precautions of chip distribution: ① A low-level single peak density does not necessarily indicate a bottom; it may also be a continuation of a downward trend. After a dense low-level single peak, if the market experiences significant fluctuations around the single peak dense area, the possibility of confirming the bottom is large.
② After the appearance of a dense bottom single peak, it is suitable for medium- to long-term wave buying.
③ After the stock price breaks through the single-peak dense area upwards, it is a buying opportunity for short- to medium-term waves.
④ Upward multi-peak density is suitable for short- to medium-term wave operations: buy when the stock price drops to the lower dense peak, and sell when the stock price rises to the upper dense peak.
⑤ If the upper peak does not move, the downward trend does not stop. During the stock price decline, if the high-level dense peak does not move downwards, it indicates that high-level locked positions still exist, and in the future, the stock price will face selling pressure from these locked positions, making it difficult for the stock price to rise. For such stocks, investors should not easily participate in medium- or long-term wave operations.
⑥ Lower peaks lock in, the market does not stop. During the stock price rising process, if the low-level dense peak does not show signs of loosening, it indicates that market holdings are stable and there is not much selling pressure. This situation often occurs in stocks with participation from main funds, indicating that the main funds have not distributed chips, so the market has not ended, and the stock price will continue to rise. For such stocks, investors can continue to hold shares or participate in wave operations.
⑦ Double peaks fill valleys, high sell low buy. When chips appear in two dense peaks up and down, the stock price often oscillates between the two dense peaks, relocating the chips. At this time, one can use the back-and-forth oscillation of the stock price in this space to perform short- to medium-term wave operations, buying when the stock price drops to the lower dense peak and selling when it rises to the upper dense peak.
⑧ High-level dense single peaks are a sign of increased risk but do not necessarily mean the market trend has ended. In actual wave operations, when a high-level single peak is dense, short- to medium-term wave operations can close positions, while long-term investments can be judged based on other information.
⑨ Chip distribution analysis is to determine the spatial position of stock prices based on chip costs. This analysis can provide a spatial range, but not specific time and price levels. When using chip distribution analysis, it is necessary to combine other technical analysis tools to find specific trading times and spatial price levels.
⑩ Chip distribution will be affected by the dividends and capital increases of listed companies, making it appear unrealistic. During the distribution process, the total chip amount of the listed company changes, and this change will be reflected in the chip distribution chart. Practical analysis needs to exclude this interference.
One tree does not make a forest, and a lone sail does not travel far! In this circle, if you don't have a good circle and lack first-hand news from the cryptocurrency circle, then I suggest you follow Lao Wang, who will guide you to profit. Welcome to join!!!$BTC $ETH

