

Check the current BTC price on Binance here
As of November 30, 2025, Bitcoin is around $91,400. To give you an idea of where we came from: we marked all-time highs near $126,000 in early October and since then we have corrected over 30%.
That drop has broken the famous myth of "Uptober", it has been the first negative October in six years for BTC (since 2018 was the last), and that has significantly cooled general market sentiment.
Meanwhile, figures like Michael Saylor remain ultra optimistic and defend that Bitcoin could end 2025 in the range of 150,000 dollars, relying on institutional demand and increasingly limited supply.
The question we all ask ourselves right now is twofold:
Will Bitcoin recover in the remaining year?
Does it make sense to keep talking about $150,000 with BTC hovering around 86,000?
Let me give you my view, mixing market data, technical analysis, and fundamentals.
1. Current situation of Bitcoin (November 2025)
Today BTC is trading around $91,400, with a recent range between $80,000 and $95,000 after a bounce from lows around $80,600.
To give you context:
Recent all-time high: ~126,000$ (around October 6)
Current BTC/USD price: around 85-87k
Drop from the peak: around 30-35%
In euros: the price ranges from 85,000-89,000€ according to the current exchange rate
In other words: we are not at cycle lows by any means, but we are clearly below recent highs. The BTC/USD pair has gone from total euphoria in October to a digestion phase with quite a bit of fear in the environment.
2. What caused this correction?
From "Uptober" to the first drop in six years
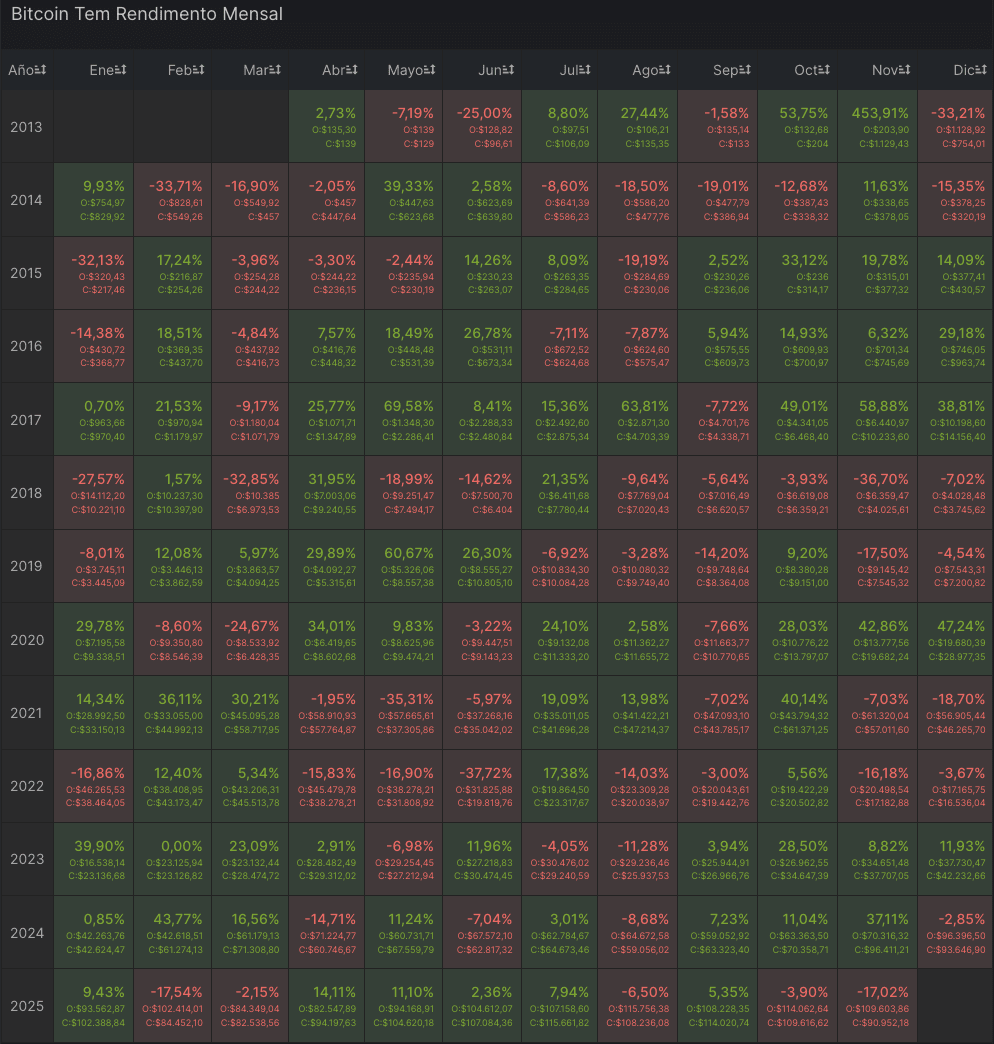
Historically, October is usually a bullish month for BTC, hence the meme of "Uptober". This year has been just the opposite: the month closed with a drop of around 4%, breaking a streak of six consecutive green Octobers.

The main causes I have identified:
Macro and geopolitical shock: Announcements of aggressive tariffs and increased risk aversion caused massive sales in both stocks and cryptos. When fear enters, Bitcoin is not spared.
Excess leverage: Many traders were ultra-leveraged after the new all-time high. The initial drop triggered liquidations in a chain reaction, amplifying the downward movement. This is what happens when everyone plays with fire.
Risk rotation: After such rapid rises, many funds and large portfolios have taken the opportunity to secure profits. It's logical and healthy, although it hurts to see it on the chart.
Bitcoin ETFs: record volume... but with sales
Spot Bitcoin ETFs in the U.S. remain the main protagonist of this cycle: last week they moved over $40 billion in volume, a historic high.
The important nuance here: there is a lot of volume, yes, but mixed with sales and redemptions. It's a sign of capitulation from some institutional money that entered during the euphoria and is now exiting scared.
Even so, the fact that the BTC ETF ecosystem moves those figures with the price in full correction indicates to me that Bitcoin is already fully embedded in the traditional financial system. That is structurally bullish in the long term.
3. What other analysts say: late bull run or end of cycle?
This is where the market is really divided, and I'm going to give you both perspectives because both have valid arguments.
The optimists: the bull run is still ongoing
Cycle analysis from various firms and specialized analysts speak of a potential cycle peak between 150,000 and 300,000 dollars between late 2025 and early 2026, based on historical models and on-chain data.
Some "cycle peak" models suggest that the bull market may be entering its final phase, but not necessarily over, in addition to the possibility of seeing extensions of the cycle.
In that same vein, bullish analysts continue to see this correction as a "shakedown" normal within a bull market, not as the beginning of a structural bear market.
Michael Saylor fits perfectly into this group. His narrative remains clear: limited supply + institutional demand + adoption as a reserve asset = target of 150,000 dollars by the end of 2025. And he hasn't just stopped at words: the company he leads continues to buy thousands of BTC on dips, reinforcing the idea that he sees this price zone as an opportunity, not as the end of the road.
He also recently said that his legacy will be to burn all the BTC he has.
The prudent: signs of cycle exhaustion
On the more conservative side, some point out that:
Some cycle analyses indicate that we are at 99% of the bullish cycle statistically speaking, and that each new peak has less relative strength.
The correction above 30% from the peaks, combined with extreme fear sentiment, suggests that we could already be in the transition to a classic bear market for Bitcoin.
My summary: Consensus does not exist. There are data to support that the bull run has not ended, but also signals to think that we are closer to the end than the beginning. And that's the interesting part, and the risk, of investing at this moment in the cycle.
4. Technical analysis: key levels I am watching
Without entering intraday trading, there are several levels that I watch closely on the BTC/USD chart:
Important supports
$80,000: Area where the price recently bounced after the most aggressive drop. If it is lost strongly and with volume, the market may interpret that the correction is not over yet.
$75,000-70,000: Range that could act as a psychological "buffer" if the market enters real panic mode. In euros, such a drop would bring the price to an approximate range of 60,000-65,000€ (depending on the exchange rate).
Resistances to watch
$95,000: First psychological barrier. Regaining it and consolidating above would be a very positive sign for the BTC/USD pair.
$100,000: Round number and old congestion zone. It is a clear reference for many institutional funds and also for retail. Breaking this with conviction would quickly change sentiment.
$126,000: Recent all-time high. Breaking this zone with volume would be a very strong signal that the market is aiming for new targets.
From there, the $150,000 zone would be the natural target for extending the movement.
A fact that may help you put this in perspective: historically, Bitcoin has had several corrections of 30-40% within very strong bull runs, just before the last parabolic leg. That we have done "around 30%" since the peaks is not unusual in the context of BTC's history.
5. Fundamentals: what's happening beneath the price?
Beyond the chart and market emotions, there are three key fundamental factors:
Increasingly rigid supply
After the 2024 halving, the issuance of new BTC entering the market is significantly lower. This means that, in the medium term, any increase in demand will be felt much more strongly in the price.
If you combine this with the amount of BTC locked in ETFs, corporate treasuries, and strong hands that are not going to sell, the part of "real float" available to buy is constantly decreasing.
Institutional demand: less linear than it seems
ETFs have shown that a lot of money can enter in a very short time... but also that those flows can reverse quickly when the market gets scared.
Funds like those managed by Saylor are aggressively accumulating on dips, which provides an important psychological floor. But that does not guarantee a straight line upwards. The market remains volatile.
Long-term perspective
If we look at it from a multi-year perspective, the contrast is brutal. Those who wondered how much 1 Bitcoin was worth in euros ten years ago were seeing ridiculous prices compared to the current ones, even after this 30% correction.
The message is not "it will always go up", but that the time horizon changes absolutely everything with this asset.
6. So... can Bitcoin reach 150,000 dollars in 2025?
Let's ground the question with real numbers.
With BTC at $86,000, reaching $150,000 implies:
Approximately +74% from the current level
About +19% above the last all-time high (~126,000$)
Historically, Bitcoin has made much more aggressive movements in shorter periods. So it is possible. Another thing is whether it is likely in the current context.
My personal reading of the scenario
I would summarize it in three possible paths:
Aggressive bullish scenario (possible, but demanding)
The market quickly digests the correction
Positive net flows into the ETFs return sustainably
The macro environment supports: low volatility in stocks, less fear of high interest rates
BTC recovers 100k, breaks 126k, and makes a final parabolic leg towards 140-160k
This would be the scenario that fully supports Saylor's thesis. It's not impossible, but it requires many things to go right.
Central scenario (the one I see as most reasonable right now)
High volatility, but no catastrophe
BTC is moving in a wide range of 80k-110k from now until the end of the year
The market takes months to decide whether there is one last bullish extension or if we enter a distribution phase
In this context, it is more likely that we will first see stability and only afterwards, in 2026, a serious attempt to surpass 150k
Bearish scenario (I wouldn’t rule it out)
More regulatory pressure or clearly negative macro factors
Sustained net outflows from the ETFs and leverage still to be cleared from the system
BTC loses 80k with conviction and enters a classic bear market, with several months of declines and sideways movement
Direct conclusion to your questions:
Can Bitcoin recover before the end of 2025? Yes, it can perfectly regain the 100,000-110,000$ areas if the market calms down and some appetite for risk returns. It wouldn't be unusual given Bitcoin's history.
Is it realistic to talk about $150,000 this year? I wouldn’t rule it out 100%, but I would consider it an ambitious scenario, not the most likely given the magnitude of the correction and the current level of fear in the market.
7. Practical keys if you're in (or thinking about entering)
Let me share with you some ideas that have worked for me over the years:
Think in horizons of several years, not weeks. The history of Bitcoin rewards much more those who endure complete cycles than those who try to hit every turn of the chart. I have seen this time and again.
Avoid decisions based solely on headlines. Neither "Bitcoin is going to a million", nor "Bitcoin is dead". Look at the chart, the fundamentals, and, above all, evaluate your personal situation and your risk tolerance.
Control the size of your position. Even if you are very bullish in the long term, make sure that a 50% correction does not blow up your personal finances. The risk must be manageable for you to sleep peacefully.
If you trade in euros, watch the exchange rate. The price of Bitcoin in euros may move somewhat differently than BTC/USD when the dollar strengthens or weakens. It's a factor that is sometimes overlooked.
8. My final perspective
In summary: we are at a point in the cycle where neither FOMO nor panic will help you.
The correction in October and November fits with what I have seen other times in Bitcoin bull markets, but it is also true that each cycle brings new nuances: now we have ETFs, greater institutional weight, a different macro context.
My personal feeling is that:
The bull market may not be dead yet
But the margin for a parabolic leg to $150,000 in such a short time is getting narrower
I have learned after so many years that the market does not move in a straight line, and that the best opportunities usually appear when everyone is scared. But I also know that one must be disciplined and not be swayed by euphoria or extreme fear.
As I always tell you: take this as information to reflect and form your own criteria, not as a buy or sell order. And if you are going to expose yourself to the market, let it be with a strategy that makes sense for you and a level of risk that allows you to sleep peacefully at night.
At the end of the day, the important thing is not to hit the perfect timing, but to be positioned intelligently for when the market moves in your favor.
Check the current BTC price on Binance here
