
ZEC is currently showing a technical bull market pattern, with prices significantly above MA200 and the market average holding cost, but the upward momentum is weakening. The market is in a high-level consolidation phase after a one-sided rise, characterized by a very small spot and contract price difference, shrinking trading volume, while the Bollinger Bands indicate that prices are close to the upper band, accumulating short-term overbought risk.
Key prices and interval structure
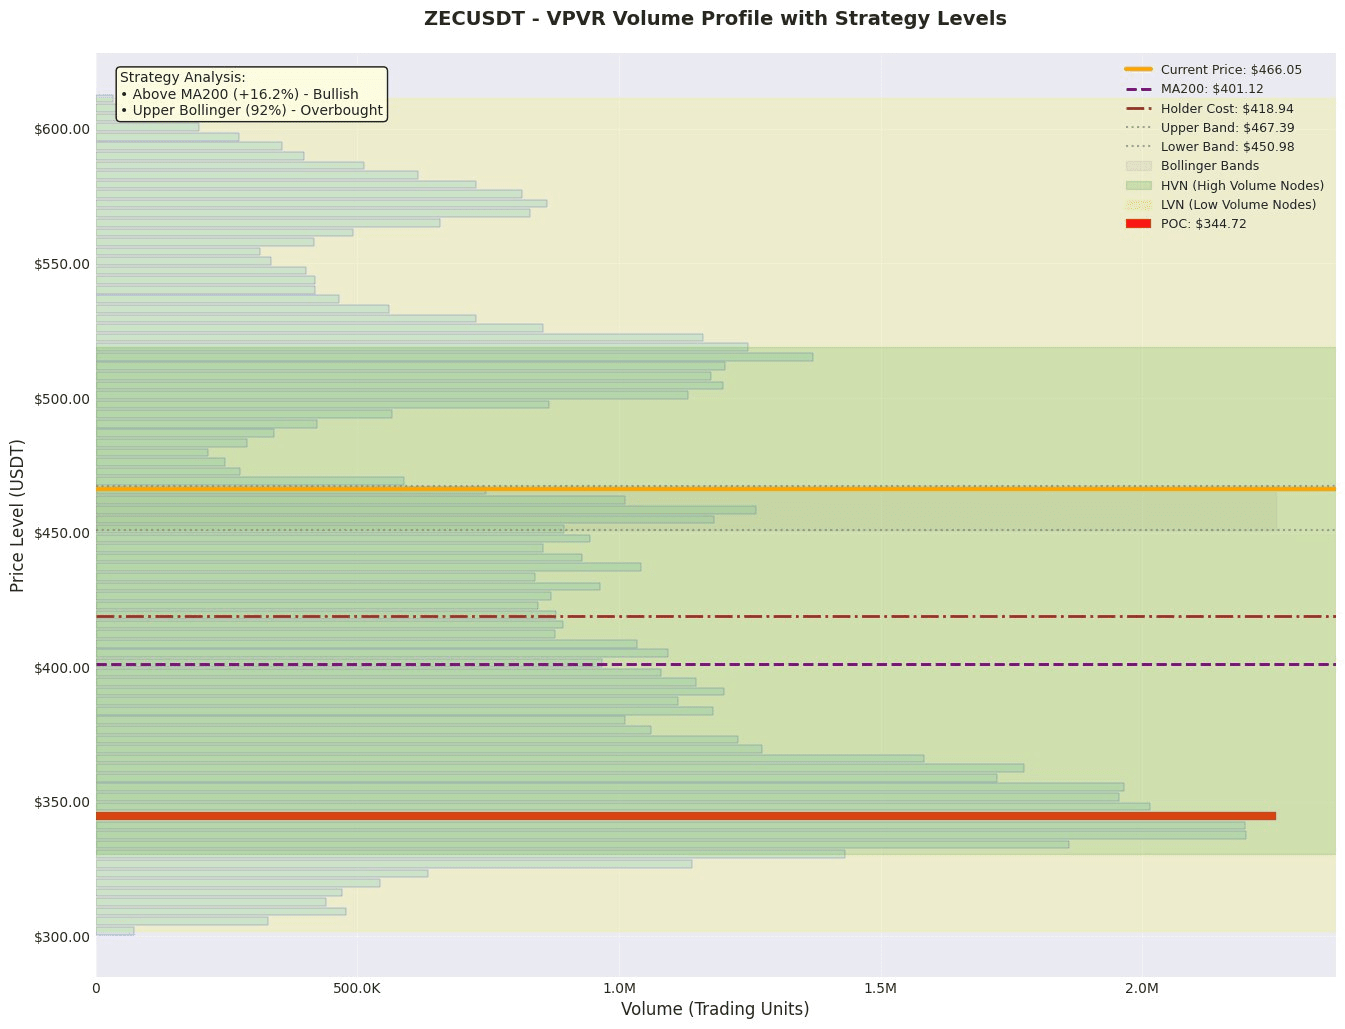
1. Value anchoring area: According to VPVR data, the current value area is from 326.95 to 522.41, with the point of control (POC) at 344.72. The POC is far below the current price, indicating that the current price has significantly deviated from the recent densest trading cost area, lacking value support below, with potential pressure for the price to return to the POC or the lower edge of the value area.
2. Trend and Volatility Range: The current price of 466.05 is well above MA200 (401.12), confirming a medium- to long-term upward trend. However, the price is near the upper band of the Bollinger Band (approximately 467.39), with the Bollinger Band position indicator reaching 91.8%, clearly indicating short-term overbought conditions, with prices facing technical retracement pressure. The upper boundary of the current volatility range, which is the Bollinger Upper Band at 467.39, constitutes direct resistance.
3. High Trading Volume / High Volume Node (HVN): According to market data, there are two significant selling concentration areas above (HVN effect), located at 510.0 (2705K) and 560.0 (3147K), which will become important resistance levels during the price rise. The buy order prices below are concentrated around 300.0 and 350.0, resonating with the VPVR's POC (344.72), forming a long-term support area.
Derivatives and Liquidity Analysis
The current derivatives market is sending cautious signals. Although the funding rate is slightly negative (-0.00045776), indicating that shorts need to pay fees, the long-short ratio has slightly decreased from 1.2531 to 1.2324, showing a slight cooling of bullish sentiment. The most critical risk signal is the 78.9% drop in contract trading volume, which usually indicates a sharp decline in market participation, liquidity drought, and prices at high levels being prone to severe fluctuations due to a small number of sell orders. The open interest (OI) of 351.47M and its ratio to market cap reaches 629.46%, indicating extremely high market leverage; once prices fluctuate in the opposite direction, it can easily trigger a chain of liquidations. Conclusion: In an environment of high leverage and low liquidity, it is absolutely unsuitable to amplify leverage; positions should be reduced, focusing on observation or light short-term operations.
News and Events Impact
In the news, it has been reported that 'Zcash gains 12% amid rising interest in ZEC treasury Cypherpunk Technologies.' This news sentiment is positive, explaining part of the market sentiment behind the recent price increase, which may attract short-term speculative funds. However, the current price has partially digested this positive news, and there is a divergence in the technical analysis, meaning the uplifting effect of the news may weaken.
Trading Strategy
Plan A: Conservative Retracement Long Strategy
• Direction: Wait and see, then wait for a retracement to go long.
• Entry Range: Wait for the price to retrace to the lower edge of the value area (VA) or near POC, specifically in the range of 326.95-344.72, or near MA200 (401.12), and look for stabilization signals (such as Pin bar).
• Stop Loss Position: Below the low of the entry candlestick or outside the key support level (such as 300.0).
• Target Position: The first target is near the recent high (Bollinger Upper Band 467.39), and the second target is in the selling pressure zone above 510.0.
• Expected Risk-Reward Ratio: Entering at MA200 (401), with a stop loss at 380 and a target of 467, the risk-reward ratio is approximately (467-401)/(401-380) = 66/21 ≈ 3.14:1.
Plan B: Aggressive Short Strategy
• Direction: Lightly short.
• Entry Range: The price is blocked near the upper band of the Bollinger Band (467.39), and the buy-sell pressure ratio (0.96x) and nearby buy-sell difference (-116,357 USDT) confirm the selling pressure.
• Stop Loss Position: Effectively breaking above the upper band of the Bollinger Band (e.g., daily close above 470) or the upper HVN 510.0.
• Target Position: The first target is MA200 (401.12), and the second target is POC (344.72) or the lower edge of the value area (326.95).
• Expected Risk-Reward Ratio: Entering at 467, stop loss at 475, target at 401, the risk-reward ratio is approximately (467-401)/(475-467) = 66/8 = 8.25:1.
Risk Warning and Position Management
1. Liquidity Drought Risk: A 78.9% drop in contract trading volume is a core risk; insufficient market depth may lead to stop-loss orders failing to execute at preset points, causing additional losses.
2. High Leverage Systemic Risk: OI/Market Cap ratio as high as 629.46%, indicating extremely high overall market leverage; a price reversal may trigger large-scale liquidations, exacerbating volatility.
3. Technical Overbought Retracement Risk: The Bollinger Band position at 91.8% clearly indicates overbought conditions, with prices far from the value area (VA) and POC, creating a strong technical demand for mean reversion.
Position Management Recommendations:
• The current environment is not suitable for heavy or high-leverage trading. It is recommended that total position risk exposure does not exceed 5% of account capital.
• Prioritize the conservative strategy of Plan A, waiting for the price to retrace to the key support area and show clear stabilization signals before entering in batches with light positions to avoid chasing highs.
• If executing Plan B, use extremely light positions (e.g., fixed risk of 1% of the account) and strictly set stop losses. If contract trading volume continues to shrink or prices quickly reverse, exit and observe immediately.
Like and follow for real-time updates!
$ZEC
