Yesterday, gold staged a dramatic rise and plunge, rapidly approaching the 4350 mark, and then fluctuated repeatedly in the 4330-4350 range. During the U.S. trading session, the 4348-4350 resistance level was strongly pressured, and the gold price directly broke below the key support of 4330, continuing to drop to the 4312 area.
At the end of the U.S. trading session, the market consolidated around the low of 4311-4313, with multiple attempts to break the resistance at 4327-4328 failing. Around midnight, the bears struck again, breaking through the 4300 mark in one go, with a minimum drop to 4285 before stabilizing and rising, ultimately closing near the 4300 mark.
This trend is reminiscent of last Friday—strong rise in the morning, high-level consolidation, and a plunge after confirming the peak at midnight, directly breaking below the morning's low. Today's market continues the rhythm of rising and falling from early morning, quickly rebounding after dropping to the 4271 area, exhibiting extreme oscillation characteristics of 'breaking the low leads to a surge, breaking again leads to another surge', with the range continuously adjusting in repeated tug-of-war.
For today's gold trend, the core focus is on the support zone of 4270-4265, which is also the key area emphasized yesterday. With 4320 as the center, the oscillation range of $50 above and below is clearly defined, corresponding to support at 4270 and resistance at 4370. Specific operations need to closely monitor three core points:
First, anchor key support to grasp the bull's defense lifeline
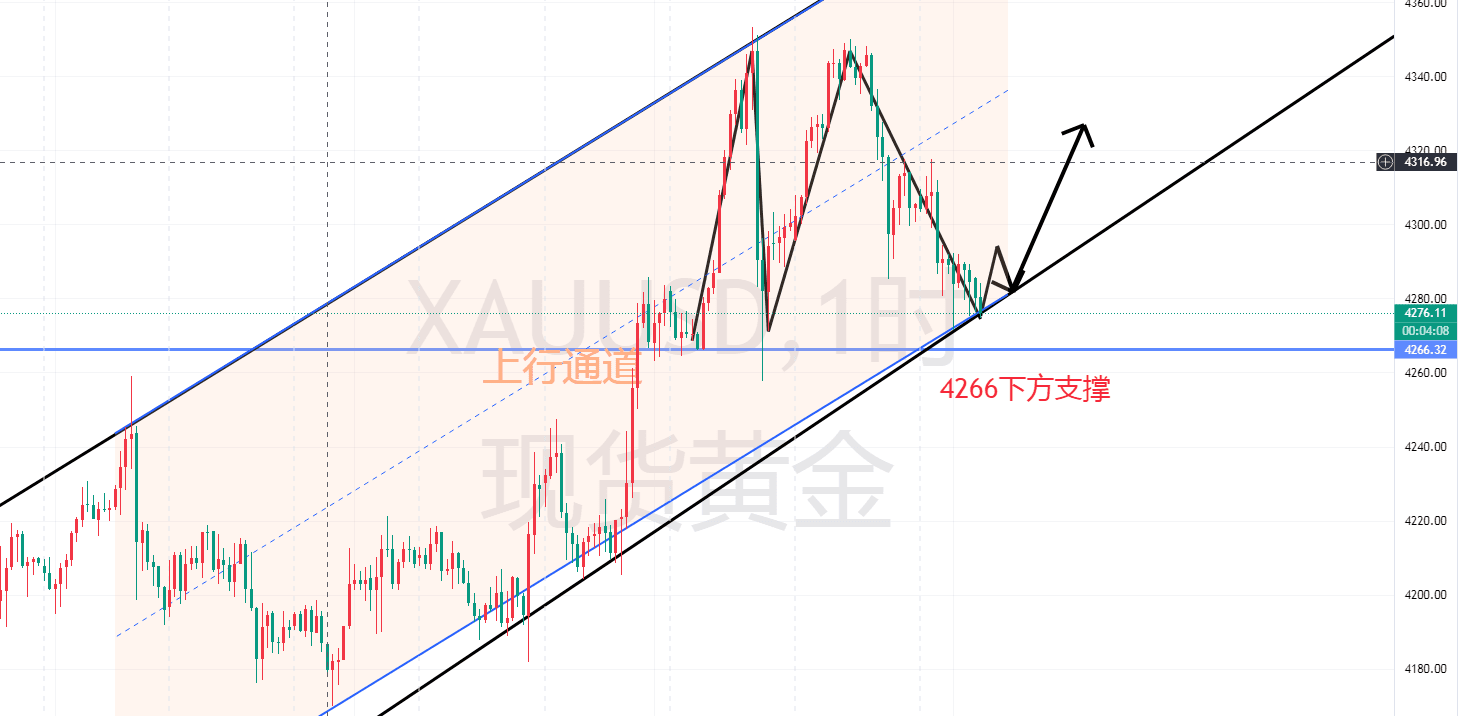
The sharp drop yesterday has exceeded the 0.618 key retracement level; the upper track of the double lines at 4266 on the hourly chart is the core defense for today's bulls. If this position is held, the rebound momentum of gold prices will continue to strengthen; if it unexpectedly breaks down, caution is needed for bears to further test the 4252-4247 area—this is the key target for a $100 drop adjustment range.
Second, accurately timing the cycle and stepping on the rhythm of market reversals
Market reversals are by no means temporary adjustments, but require a complete release of the time nodes for declines and rises before entering a new phase. The time cycle can be divided into three major periods: the period for establishing the trend in the morning session, the trend continuation period from the European session to the American session, and the trend reversal period around midnight. Only by thoroughly understanding the time rules can one accurately grasp the direction change.
Third, closely monitor the boundaries of the range and clarify the breakout signals for bulls and bears
The current large range oscillation pattern remains unchanged, with 4320 still being the dividing line for bulls and bears. Attention should be paid to the resistance area of 4327-4330 above—this is the key pressure level repeatedly tested in yesterday's American session, and it is also where the green trend line is located. Only by stabilizing above 4330 can gold prices start a new round of upward trends.
During the European session, gold prices repeatedly tested the resistance at 4292-4305 before being pressured down, and then repeatedly contested around this area. The support below overlaps the 4272-4266 range, and short-term operations can be focused around this range.
As a firm bull camp,
Operationally, it is recommended to decisively take a low position relying on the support zone of 4272-4266, setting the stop loss at 4256, and the initial target is 4292-4305; if this range is broken, further upside is expected according to the equal distance principle, looking up to 4312-4320, with the ultimate target aiming directly at 4330.
If the market unexpectedly breaks down the support, then focus on the support areas below 4255-4250 and 4220-4230.