🚨 What does it look like?$BTC What are my ten technical and basic reasons for expecting a decline first before rising to a new historical peak?
💥A comprehensive analysis without any bias, based on purely technical factors.
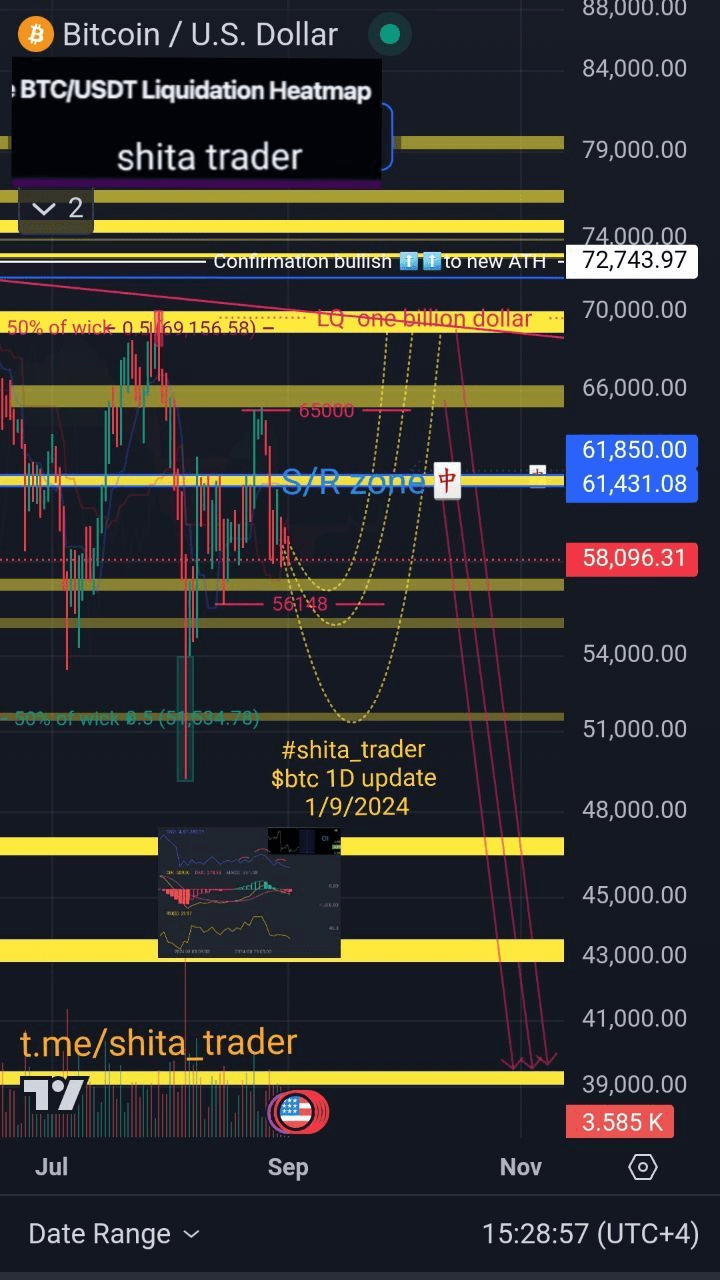
1. Let's agree that the price is best at searching for areas of greater liquidity accumulation. Unfortunately, the btc$ heat map indicates more liquid areas below, at 40K and below, as shown in the last chart. The areas in yellow are liquid areas, and the brighter the yellow, the more important the area is for liquidity. Watch the yellow areas.
2. The Relative Strength Index (RSI) on the daily and weekly frames indicates negativity and is trading below 50 and weak volume during the recent rise of Bitcoin.
3. MACD indicator negative cross below zero line
4. Open Interest Index (OI) Explanation of what OI is👇
(When the price is moving in an uptrend and the total open interest (OI) is increasing, this indicates an influx of new money into the market, reflecting aggressive new buying, which is considered bullish.
However, if prices rise while OI falls, this indicates that the rise is primarily driven by short covering, meaning that money is leaving the market rather than entering. This action is considered bearish.)
👈🏼During the recent rise of $btc, OI was following a downward trend and this is a negative signal that means I am rising in order to liquidate positions and the trend will reverse⬇️
5. OBV (On Balance Volume) Line Indicator
Explaining what is OBV👇
(OBV Indicator) If there is a strong trend, the OBV line should follow the same direction as the price trend. If prices are trending down, the OBV line should follow the same direction.
When the OBV line fails to move in the same direction as the prices, it indicates divergence and warns of a possible trend reversal.)
👈🏼Unfortunately, this is what we saw with$BTC Since it reached 70k difference with obv
Although the price last rose from 49k to 65k, the OBV is still in place, indicating a potential weakness in the trend.⬇️
6. MA Moving Averages Indicator
We have lost the trend on all moving averages and simple averages, on the daily and weekly frames.
👈🏼When the trend is strong upward, prices usually trade above these EMAs and SMAs. However, we are now trading below all of them, losing them one by one and this is evidence of the continued decline ⬇️
7. We are recording lower highs and lows in a weekly range, a bearish signal 👈🏼 and the formation of an expansion pattern and a triple top in $BTC. This pattern represents a recurrence and great importance and often occurs at major market tops.
👈🏼Triple Top: A triple top is not completed until the support levels along the two overlapping bottoms are broken.
Bitcoin price is forming two bearish patterns on the weekly chart, namely an expansion pattern and a triple top with one weekly close below the 60K support level at 56K ⬇️
8. Wavewise, as I explained to you previously, I do not currently see any logical scenario for the end of the correction, nor do I see any indications that we are in an upward impulse wave. Weak volumes and a triple rise from the last bottom and a long period in a limited range. These are not indicators of an upward impulse wave.
9. $btc moved and rose by 400% in one year. This makes the correction and decline by 50-60% logical and natural.⬇️
10. Away from technical analysis and go to the basics 👈🏼 Historically, the charts of BTC and S&P, at the same time, fluctuations occur and this price movement is repeated annually. The market drops a little after Jackson Hole, rises strongly after the Jackson Hole conference, then drops sharply in September. This happens year after year 👈🏼 And every time they say this time is different until the market proves them wrong
🚨General trend of $BTC⬇️⬇️
🔚Many key factors and liquidity chart, patterns, Volume, MACD, RSI, OI, OBV indicate the end of the trend and a possible reversal of$BTC On the larger time frame
👈🏼This indicates caution. However, this does not mean that $btc will drop today or tomorrow or that it will not return to the 64-65k range. Or the 67-69 range I think the heat map for liquidation indicates pumping and small rise⬆️ of these areas for liquidity to exit before the bigger drop 🔽⬇️⬇️⬇️🔽
👈🏼These are my top 10 reasons for Bitcoin's technical outlook and I have five more but not as important.
.. Do you or any analyst you follow tell you that there are only five technical and logical reasons for Bitcoin to rise to a new peak before falling??
You are not happy with the two lines and they tell you that you are going to 100K at the end of the month
👈🏼The key🀄 is to trade the levels and be careful, then be careful. Your entry should be in small quantities in parts, and take profits when they approach the top, then buy again at the bottom of the trend line.
Repeat this process for consistent gains!
🤷♂️This is my point of view, it may be right or wrong. DYOR#
Sorry for the length, but maybe someone will benefit and learn 💚
Powered by shita_trader  #BTC #Binance
Article
10 technical and fundamental reasons to expect Bitcoin to fall before reaching a historic peak🔊