Based on the chart you provided, here’s an analysis of potential next moves for UXLINK/USDT:
1.Current Market Context:
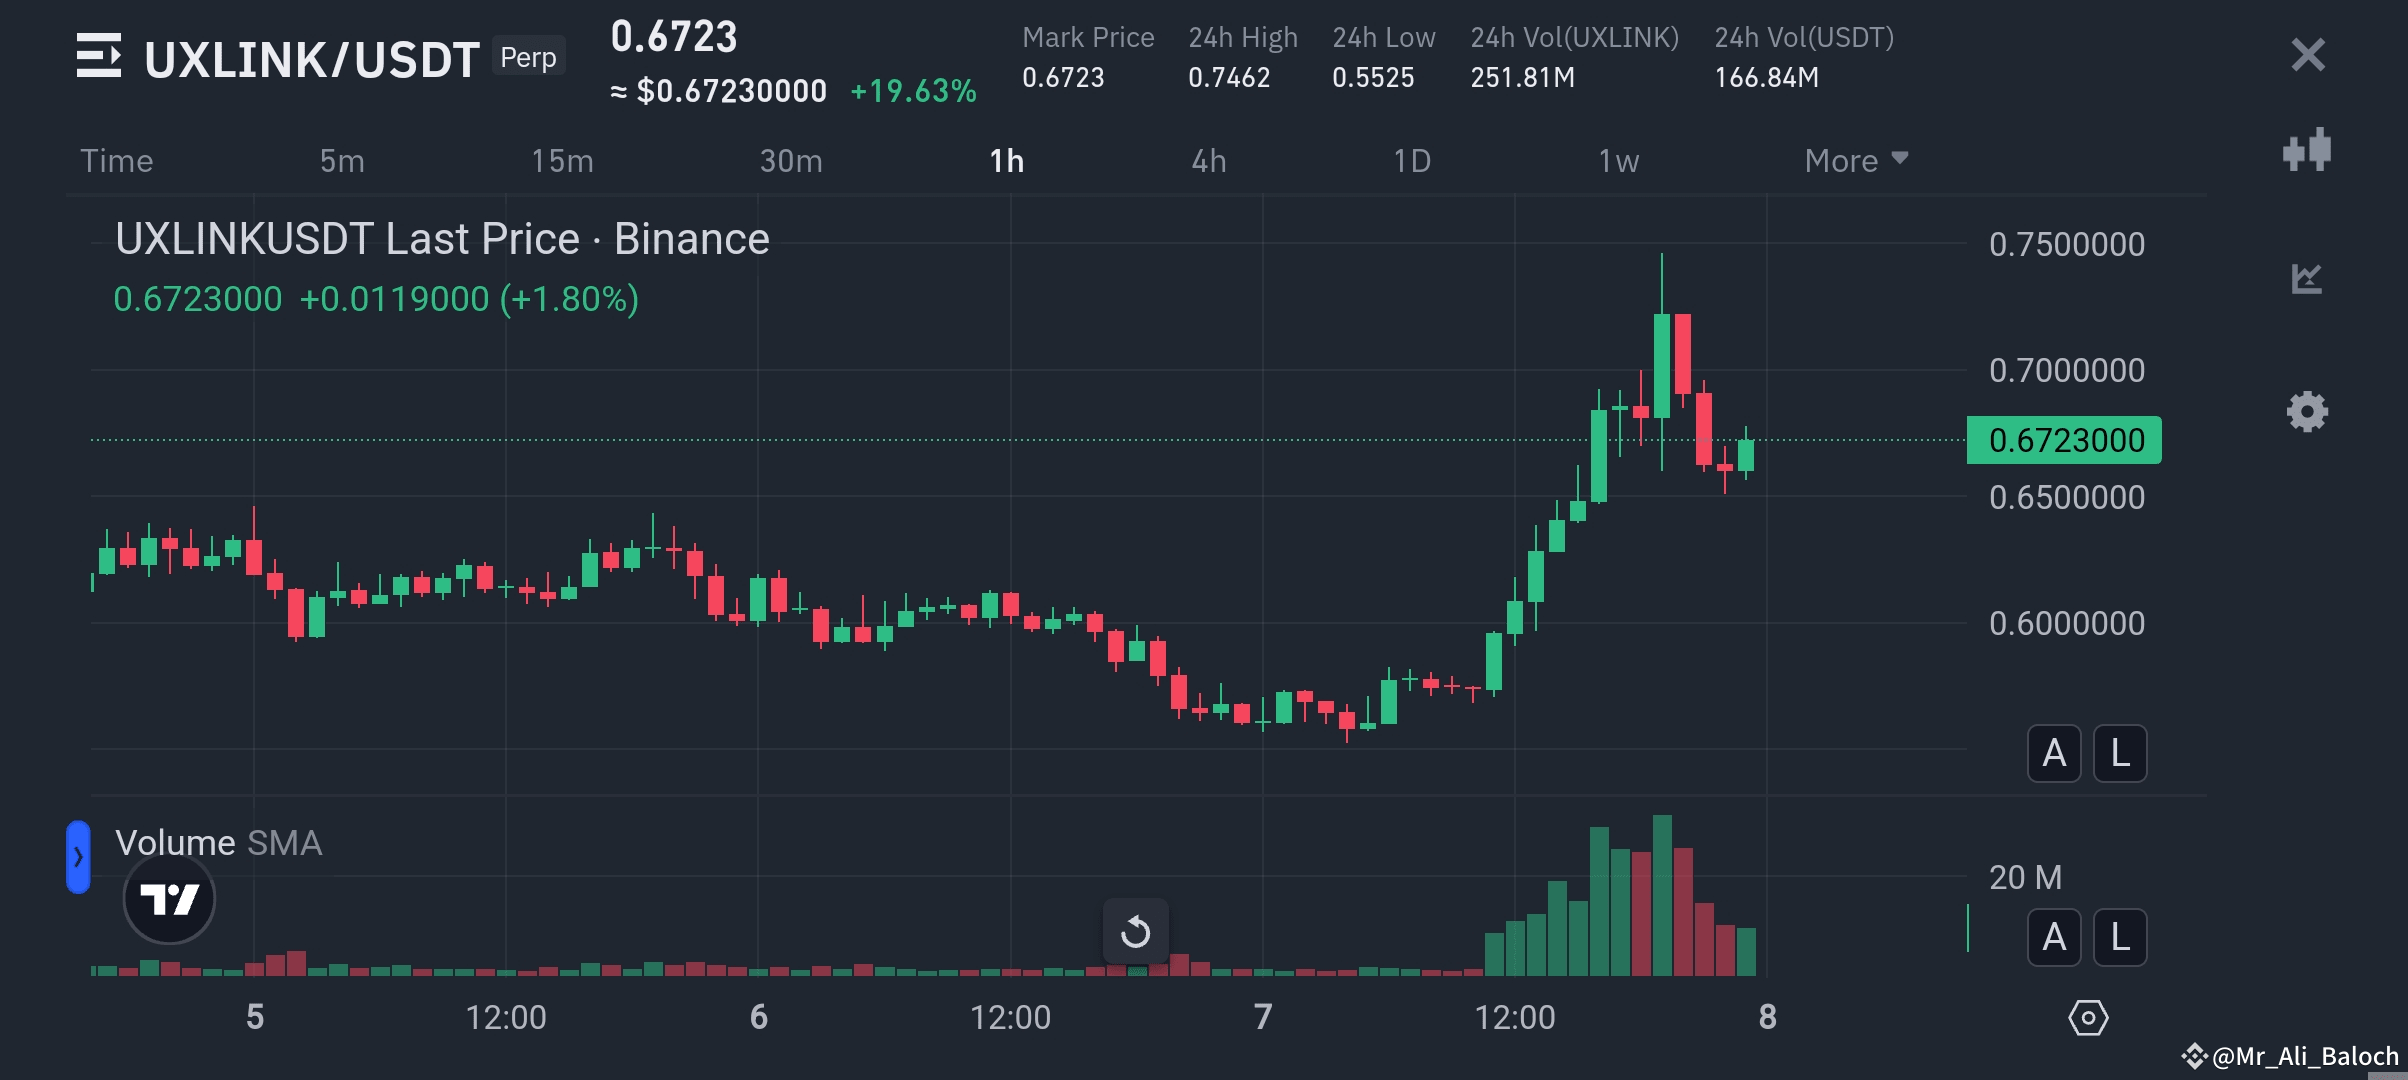
- The price appears to have risen sharply, followed by a retracement.
- Recent bullish momentum is visible, but some red candles suggest sellers are active.
2. Support and Resistance Levels:
-Support: Around $0.6500 appears to be a key support level from recent price action.
Resistance:Near $0.7000-$0.7500 could act as a resistance zone based on the recent peak.
3.Volume Analysis:
- The increasing volume during the price spike suggests strong buying interest.
- Current volume seems lower, indicating reduced trading activity or consolidation.
4. Indicators and Patterns:
- A retracement after a significant rally might indicate either a continuation after consolidation or a possible reversal.
- If the price holds above $0.6500 and volume increases, there may be a bullish continuation.
- Conversely, a break below the support level may signal further downside.
Recommendation:
Watch for a clear break of f $0.7000 for a bullish continuation or a dip below $0.6500 for a bearish move. Confirm with volume trends and any additional indicators for better clarity.